peek and pick at mri's heap, part 1
While I’ve been spending a lot more time on JRuby-land, over the past year a number of very interesting tools have sprung up to analyze and debug MRI memory usage which are not very known but are rather kick-ass.
So without further ado, here is the first of three tools you can use to look at your MRI heap, rather than just banging your head against the table when you have to investigate memory problems: Rbkit.
Rbkit is composed of two components: the rbkit gem, which you include as usual in your Gemfile, and a desktop client application which connects to your ruby app and allows you to interact with it—and that you’ll have to download and install separately from Rbkit’s website.
To use it, just
require 'rbkit'
Rbkit.start_profiling
and start your application. Then just open up the rbkit desktop application and use the default connection settings to connect to your application.
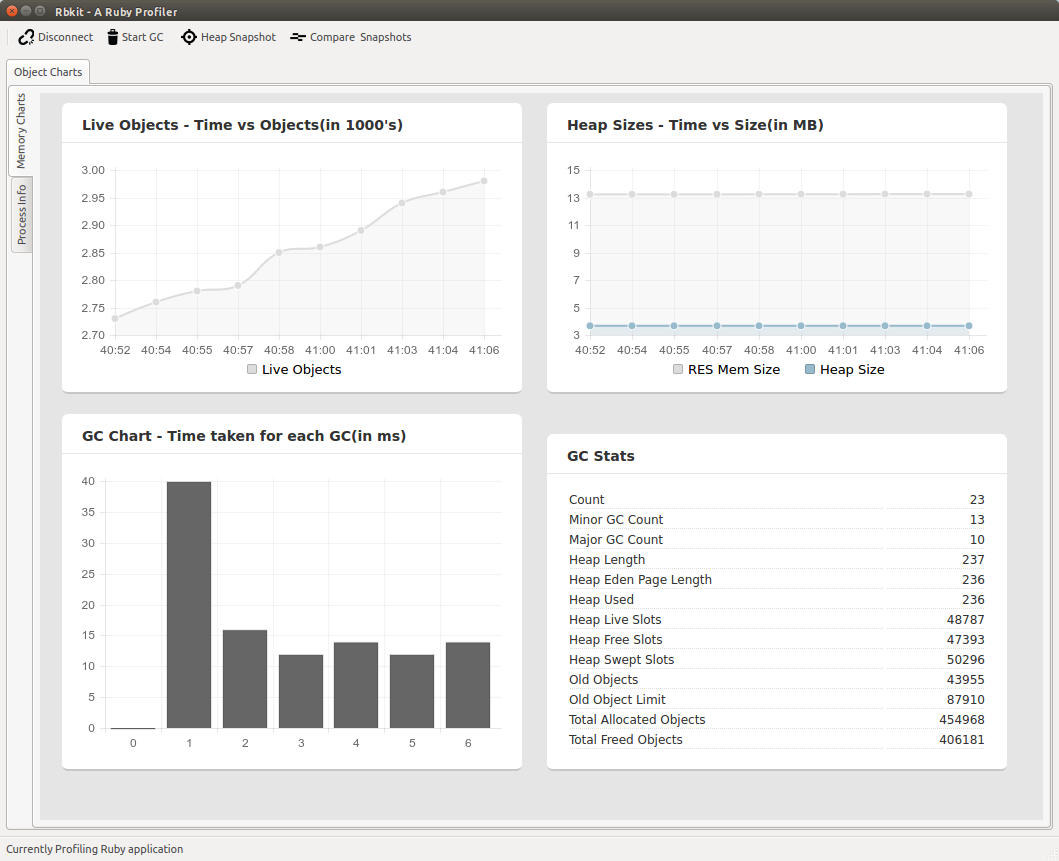
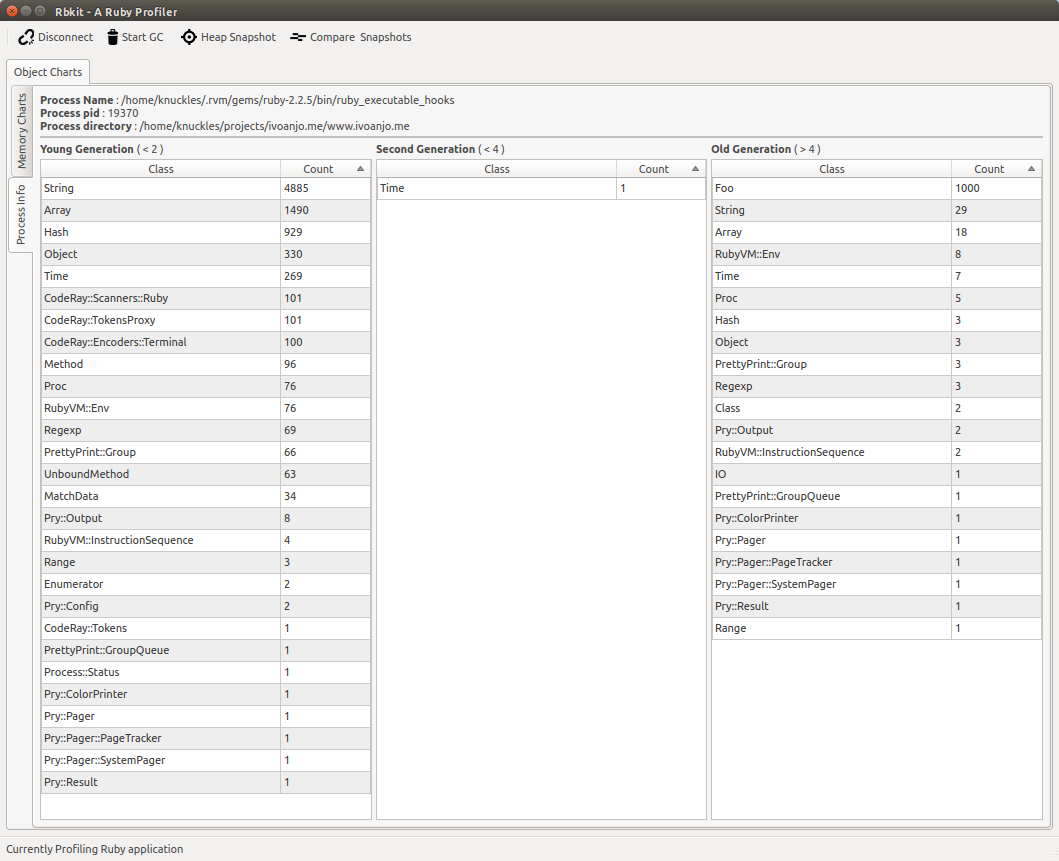
Besides the real-time memory charts, Rbkit also allows you to monitor the multiple GC generations…
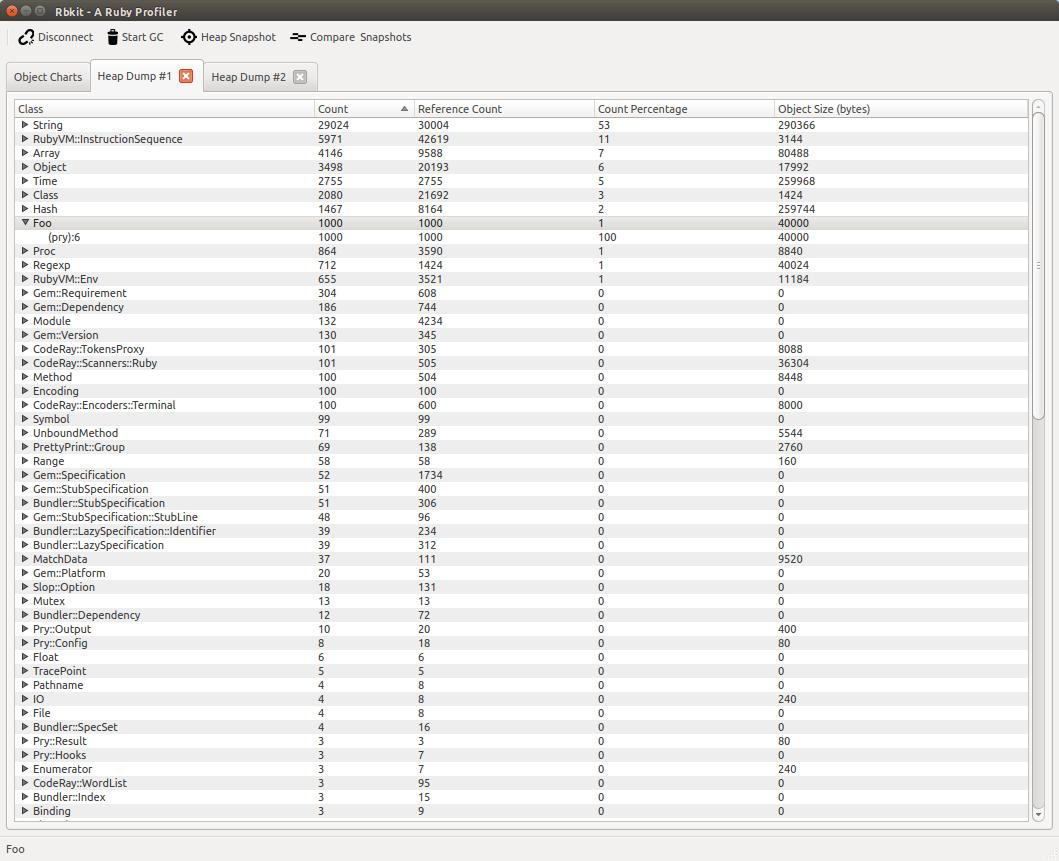
…take heap dumps…
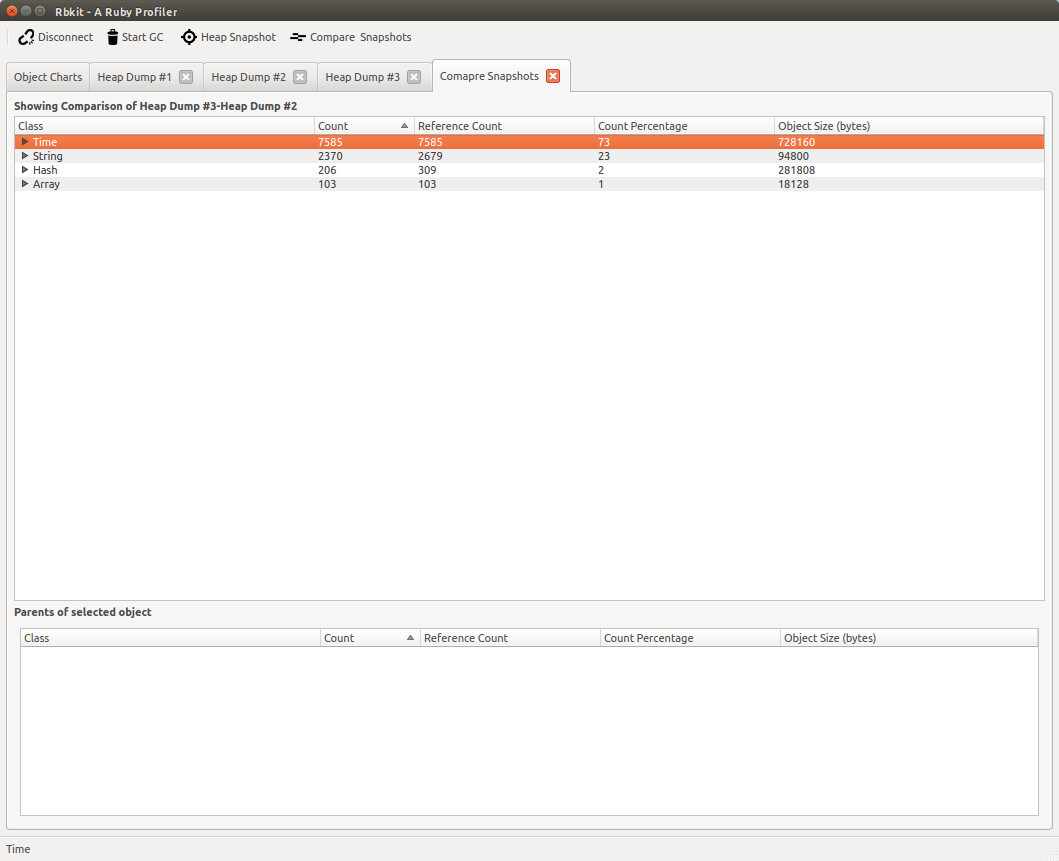
…and compare heap dumps.
Unfortunately, I wasn’t able to get Rbkit to work with ruby 2.3.1, but it works without issues on 2.2.5, so even if you normally run 2.3.1, it’s probably not very hard to get your app on 2.2.5 while you’re debugging some issue.
You also cannot save heap dumps for later analysis (or with other tools), so hopefully that’s an improvement that will soon be contributed to the gem.
Overall, Rbkit is a very interesting tool to add to any rubyst’s toolbelt. Stay tuned for parts 2 and 3, where I’ll look at more awesome tools to peek and pick at mri’s heap!


