ninjas’ guide to getting started with visualvm
VisualVM is a free Java/JVM tool that ships with most Oracle JDK/OpenJDK installs (if you’ve used Erlang’s observer previously, it’s a similar tool). It can be used to both profile and debug applications running on the JVM—including Java, JRuby, and many others.
I’ve mentioned it several times before on this blog as part of my JRuby voyages, as it’s my go-to tool to start investigating any kind of issue in a JVM application.
Recently, I’ve written a thorough guide on VisualVM’s features (including a special section with cool JRuby goodies) for Talkdesk’s Engineering Blog. You can check it out embedded below or at https://engineering.talkdesk.com/ninjas-guide-to-getting-started-with-visualvm-f8bff061f7e7.
What is VisualVM?
VisualVM is a free Java/JVM tool that ships with most Oracle JDK/OpenJDK installs (if you’ve used Erlang’s observer previously, it’s a similar tool).
This tool can be used:
- in development: connecting to applications running on the local machine and on docker
- in test environments: connecting to live Heroku dynos or AWS systems
- in production environments: connecting to live Heroku dynos or AWS systems (with important caveats, discussed below in the Debugging with VisualVM section)
VisualVM can be used with all JVM languages (Java, JRuby, Kotlin, Scala, …). It works at the VM layer which means that high-level concepts from other JVM languages are missing, and instead you’ll see their “under the hood” representation. But don’t let this scare you off, you can still get plenty of useful information, even with this limitation.
This guide is divided into several parts:
- Getting VisualVM: A simple getting started guide.
- Connecting VisualVM to a running application: How to get VisualVM talking to your application, locally or otherwise.
- Debugging with VisualVM: What you can do with VisualVM.
- Recommended plugins: Turbocharge your VisualVM install.
- JRuby goodies: JRuby-specific tools and techniques.
- Further exploration: Other suggested awesome JVM tools.
Getting VisualVM
If you have the javac command, you should also have visualvm or jvisualvm. As of this writing, the latest version is 1.3.9, which I recommend you use.
If you don’t have the latest version (or any version at all), go to VisualVM’s website and make some magic happen.
Connecting VisualVM to a running application
Local application running natively
This is a simple one step process.
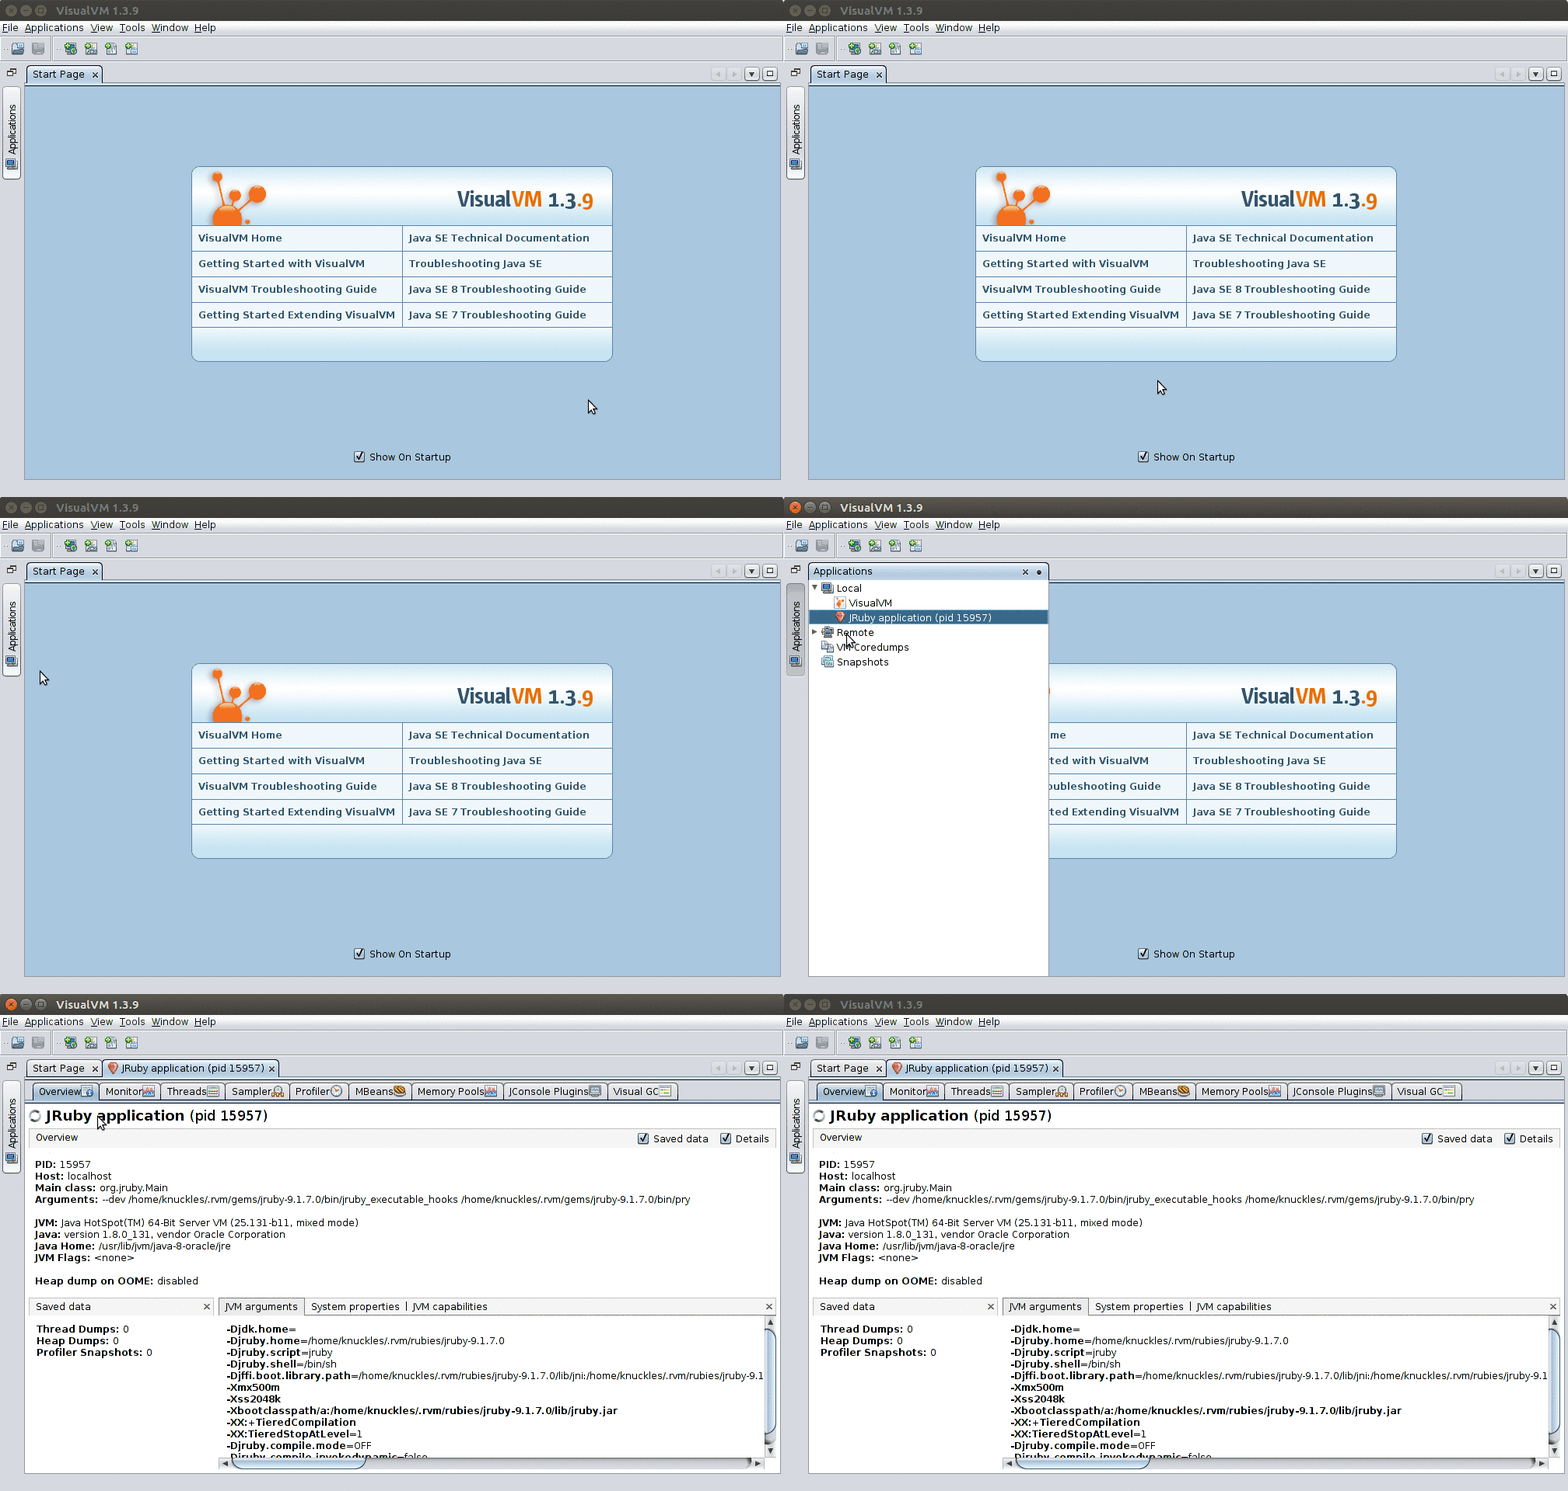
Step 1: Go into the applications tab. There you will find your application.
Local application running inside Docker
You’ll need to enable the VM remote management extensions by defining an environment variable and expose the management port outside of docker.
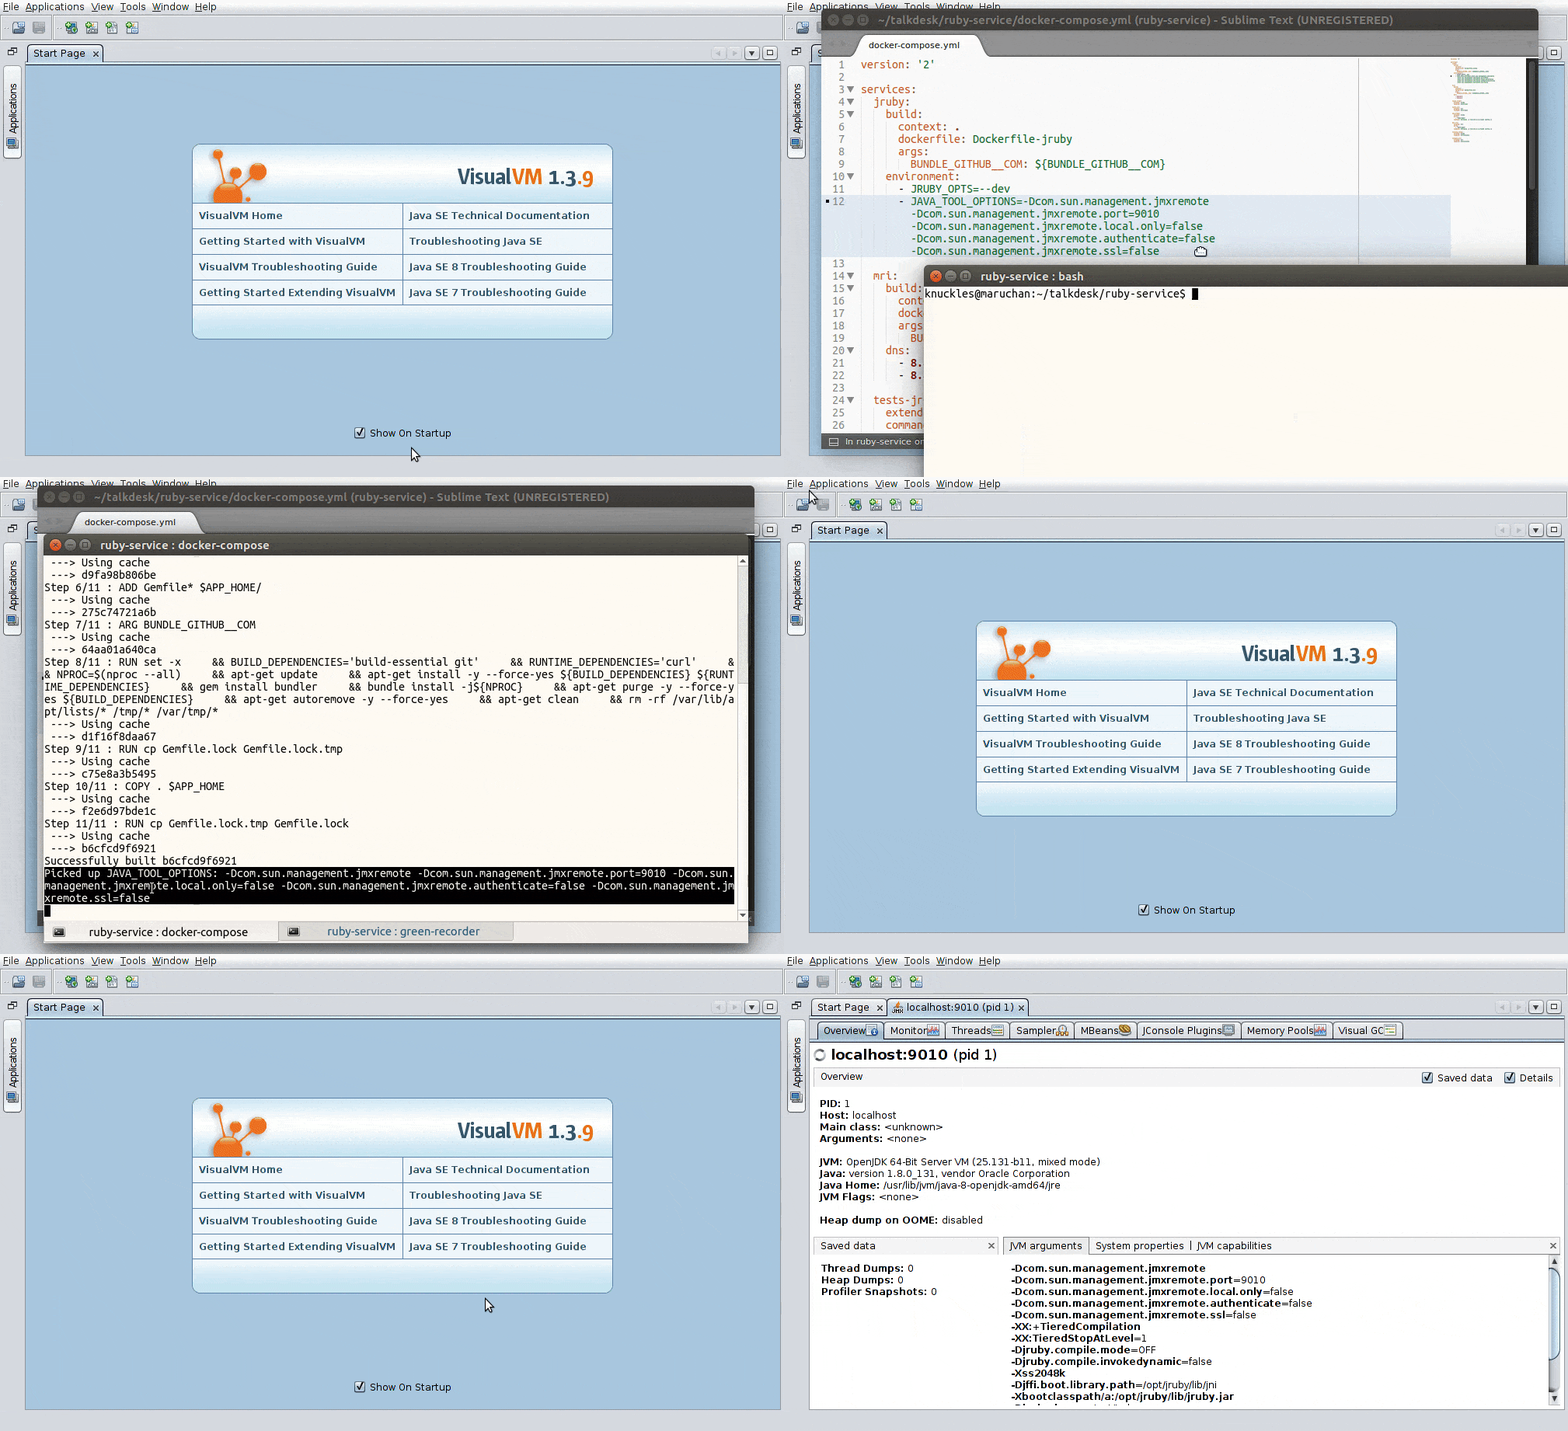
Step 1: Go to your docker-compose environment and add the JAVA_TOOL_OPTIONS environment variable with the following configuration:
JAVA_TOOL_OPTIONS=-Dcom.sun.management.jmxremote -Dcom.sun.management.jmxremote.port=9010 -Dcom.sun.management.jmxremote.local.only=false -Dcom.sun.management.jmxremote.authenticate=false -Dcom.sun.management.jmxremote.ssl=false -Djava.rmi.server.hostname=localhost -Dcom.sun.management.jmxremote.rmi.port=9010
Step 2: Then, when running your docker container, expose port 9010 to your local machine:
$ docker-compose run -p 9010:9010 <your service>
Step 3: Now you’re all set to connect using VisualVM. Go to File > Add JMX Connection… Use localhost:9010 as a target. Don’t touch any of the other options. Then, press OK. A new “localhost:9010” entry should appear on the applications list. Double-click it to get the magic to happen.
(See also https://medium.com/@logbon72/this-was-quite-helpful-34b56ab7b175 that lists a few extra tweaks to get docker to work)
Remote application running on Heroku
Step 1: Start by installing the heroku-cli-java plugin for the Heroku cli. This only needs to be done once because it adds to the Heroku cli, not to any specific app.
$ heroku plugins:install heroku-cli-java
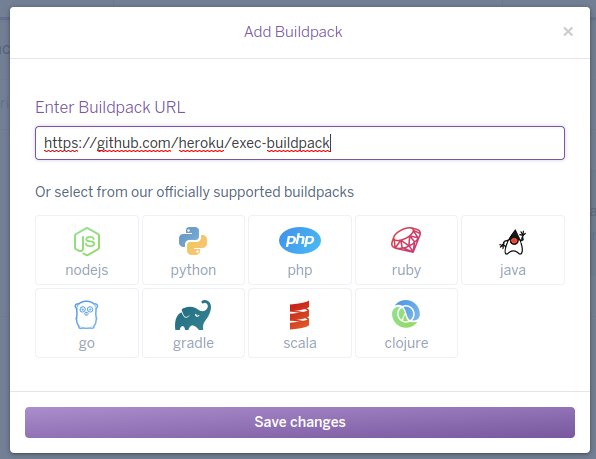
Step 2: You’ll also need to add the exec buildpack to your Heroku application. This will install some extra tooling into the deployed container image that we’ll use to access the remote dyno.
Step 3: As Buildpack changes are only applied after re-deploying, you now need to re-deploy your application.
Step 4: AFTER RE-DEPLOYING YOUR APPLICATION, *ahem* you can now use the following command:
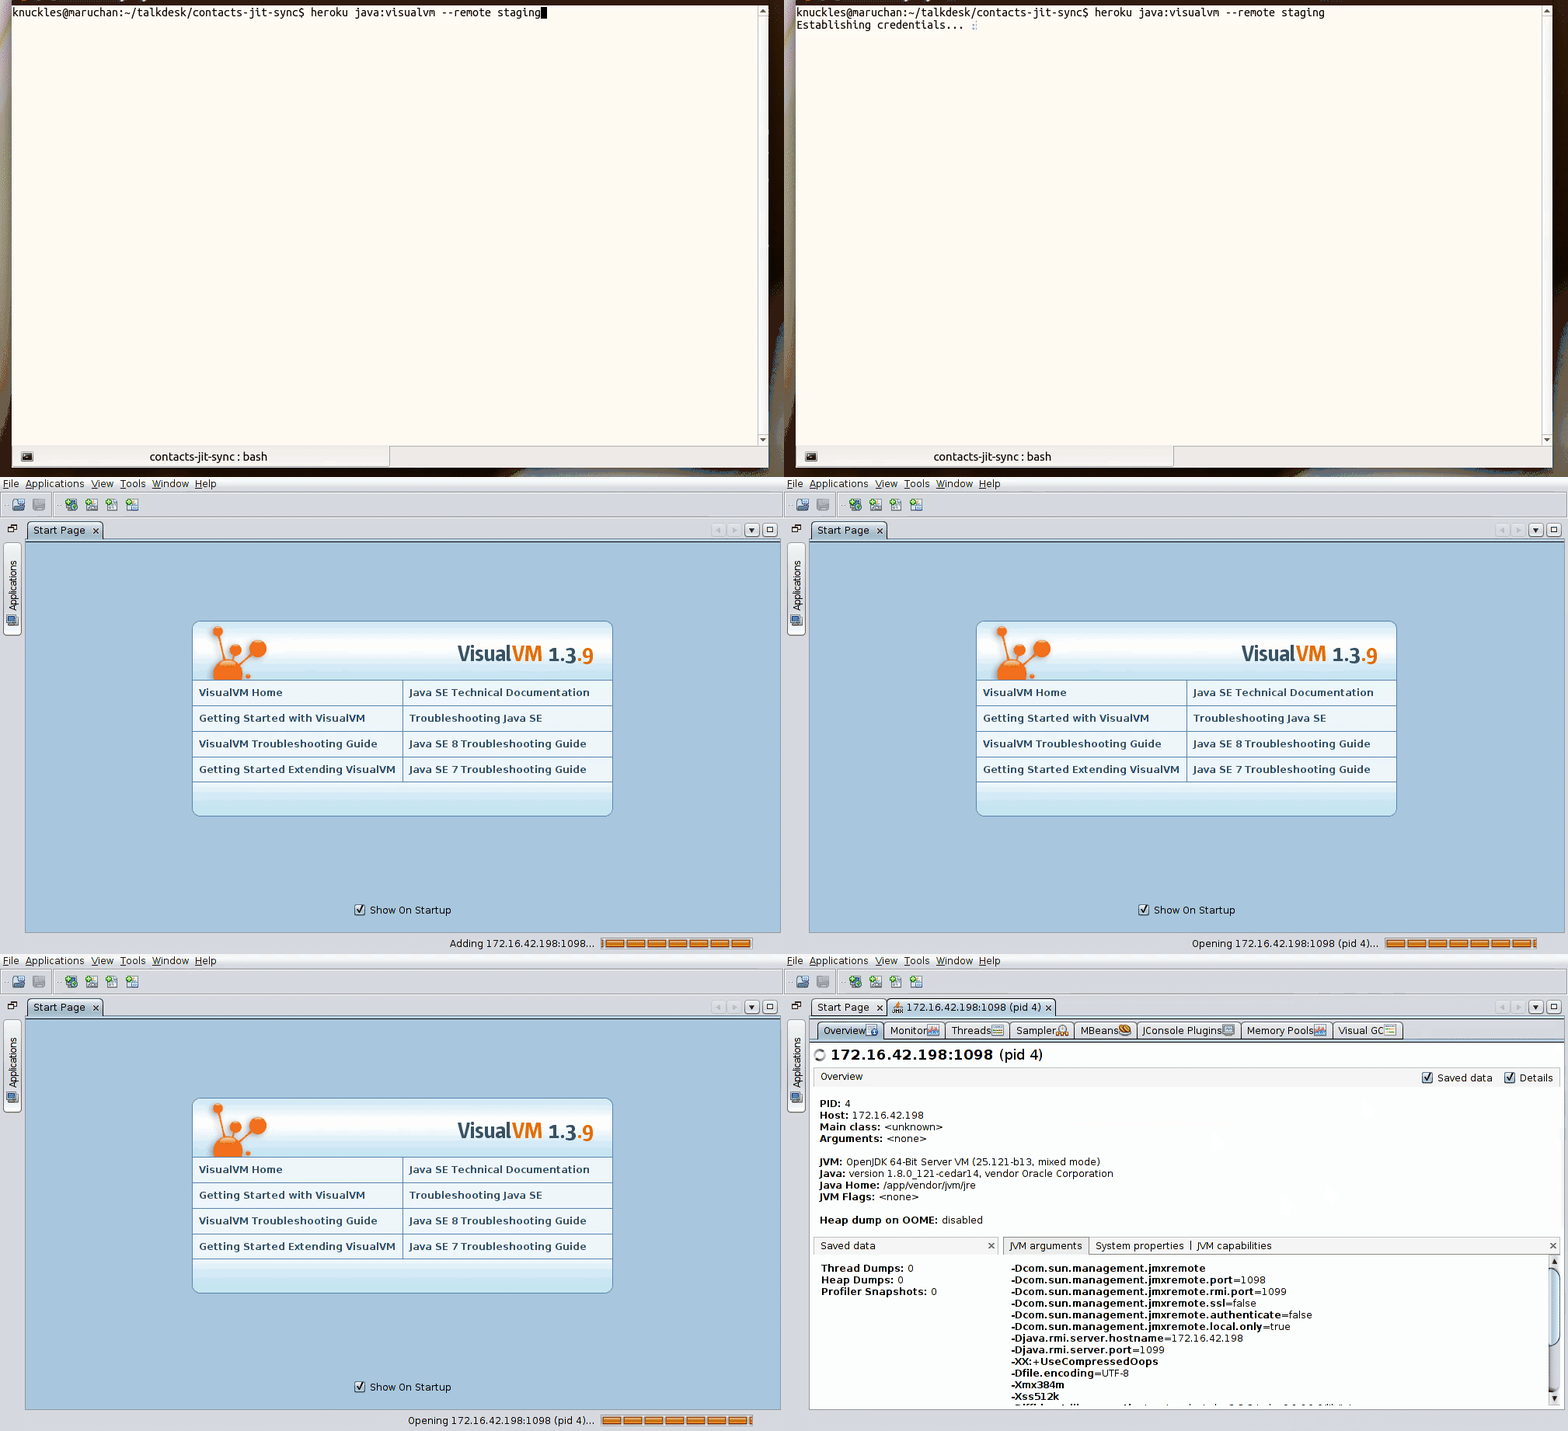
$ heroku java:visualvm --app <your heroku app> --dyno <your dyno>
If it all goes well, VisualVM will pop up and start connecting. You may see a warning about the connection being insecure which you can ignore. The connection process may also take a while (around 10–15 seconds).
Note: If you do not specify a dyno, Heroku will default to web.1 which will net you a “Could not connect to dyno!” error on applications without web dynos.
Heroku connection gotchas
1. VisualVM error when connecting to remote dyno
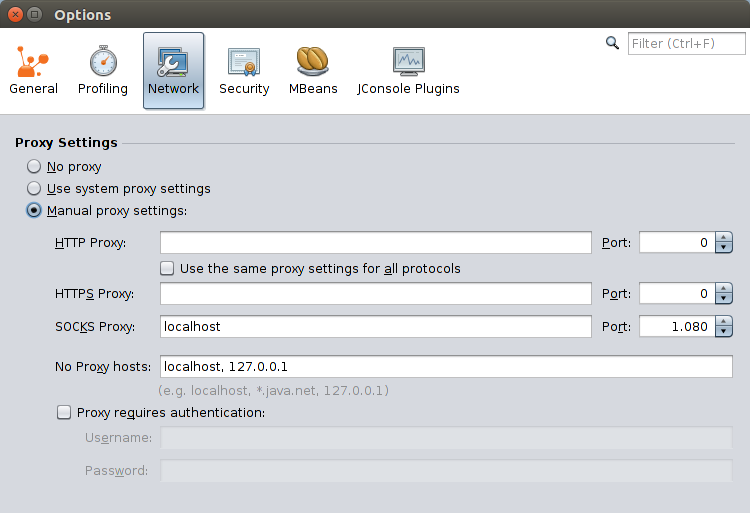
If you get a “Cannot connect to <foo> using <some url>” error message, manually configure your proxy settings as shown below:
Note: You’ll probably want to undo this setting next time you want to connect to a docker container or a local application.
Debugging with VisualVM
In this section I’ll go into some of the investigation and debugging tasks you can do with VisualVM. Note that if your VisualVM does not look like mine, you’re probably missing one or more of the plugins I have installed. See the next section for an overview of them.
Production caveats:
Be wary about using these tools and techniques in production.
Some of them can have a big impact on the performance and responsiveness of your running system, thus you may end up making an ongoing problem even worse. I will attempt to indicate where you should be extra careful when using certain mechanisms. If you’re unsure, always plan to monitor closely, and preferably pair on the work before going all rambo into production.
Monitor panel
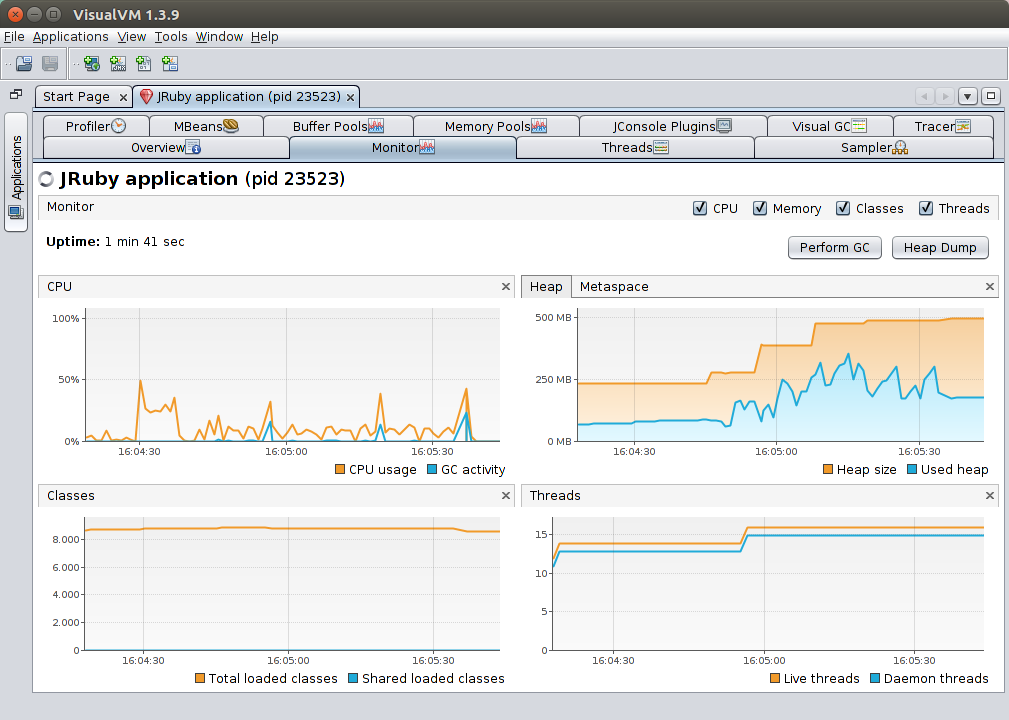 This is actually not the same picture as the one in the introduction
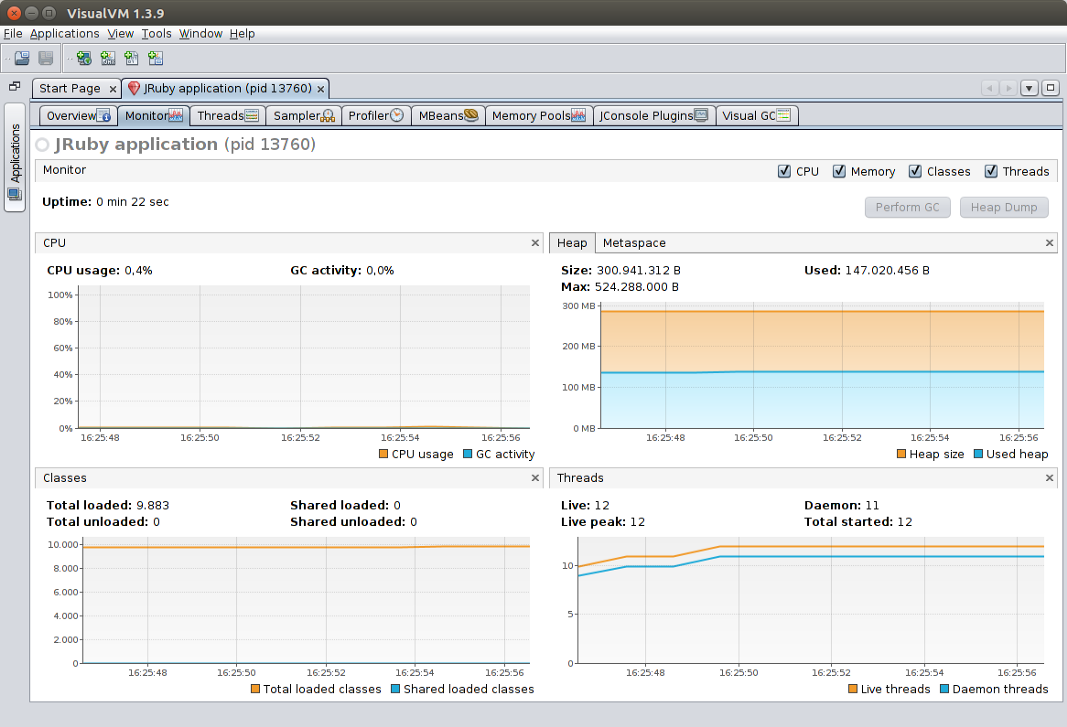
The Monitor panel presents at-a-glance info on the overall state of the VM:
- CPU: usage as a percentage of total machine resources, e.g. a fully-loaded thread will be at 25% on a four-core machine
- Heap: the main memory arena where objects and arrays are kept
- Metaspace: a separate memory arena where classes and other JVM metadata are kept
- Classes: number of classes loaded on VM (includes automatically-generated classes)
- Threads: number of threads in the VM. Live threads are daemon + non-daemon
The “Perform GC” button triggers a full garbage collection.
The “Heap Dump” button requests that the JVM take a heap dump. BE CAREFUL: Taking a heap dump means stopping all application threads while a possibly multi-gigabyte file is written. Your Java code will be suspended until this process finishes. One caveat of this functionality is that it only works seamlessly when VisualVM is accessing an app running natively on your machine. If you’re connecting to a Docker container or Heroku dyno, you’ll be asked where to save the file remotely, and you’ll need to manually transfer the heap dump file to your local machine and open it with “File > Load…”.
Update: On Heroku you can use the following command to take a heap dump and automatically download it:
$ heroku java:jmap --app <your heroku app> --dyno <your dyno>
Thread panel and monitoring thread state
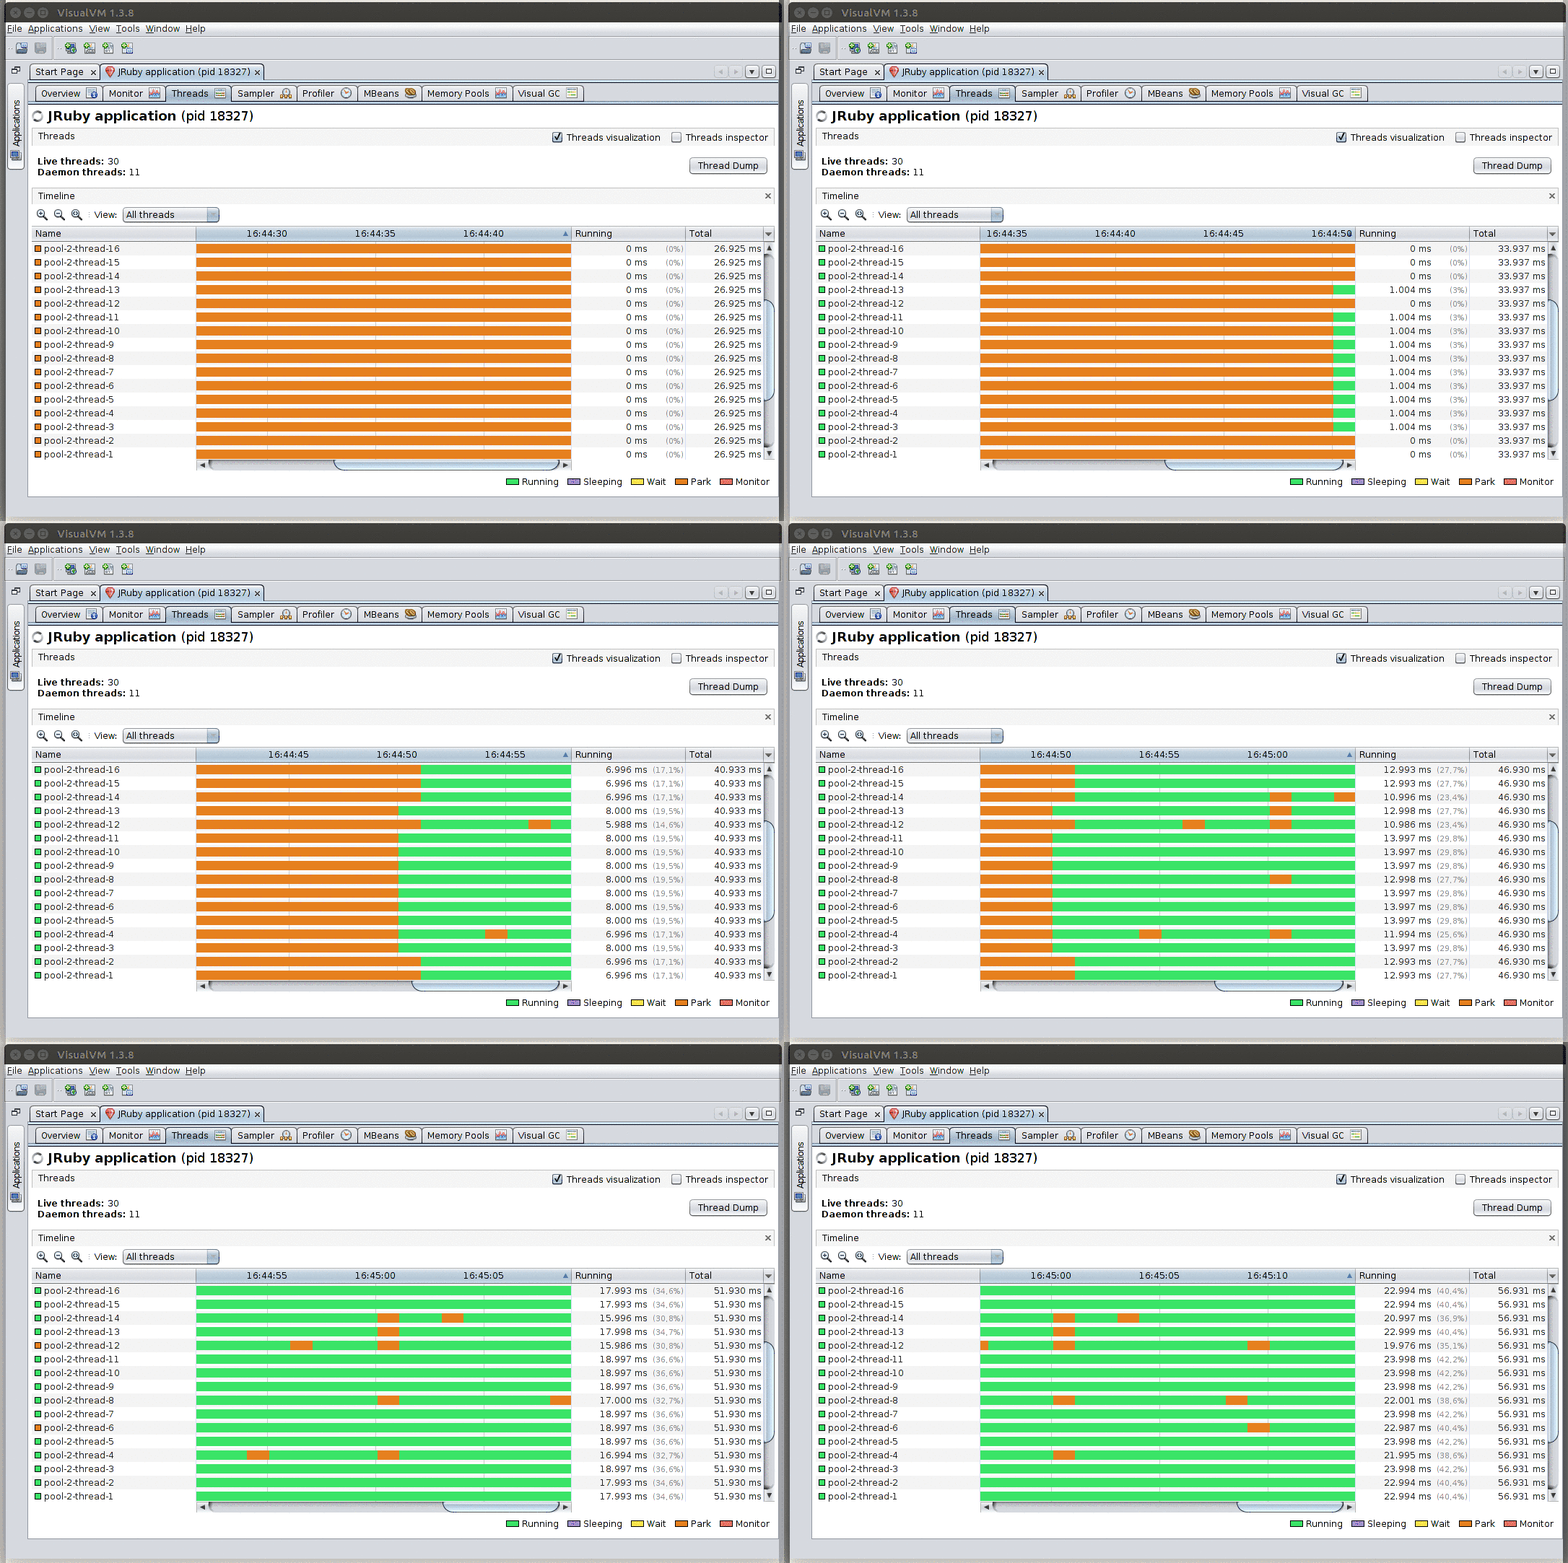
This panel gives a view of the state of every thread in your application. If you expect your system to be fully loaded (e.g. during load testing) and instead of seeing all or mostly running threads (green), you get parking (orange), waiting (yellow), or blocking on a monitor (red), those are strong indicators that something may be off.
From this panel you can also ask for a Thread dump: a listing of the stack traces of all running threads. Note that for non-Java JVM languages, these stack traces will probably not map 1:1 to the methods you wrote on your IDE (e.g. you’ll be looking at how that language gets translated to JVM bytecode; see below for some language-specific notes).
Navigating a heap dump
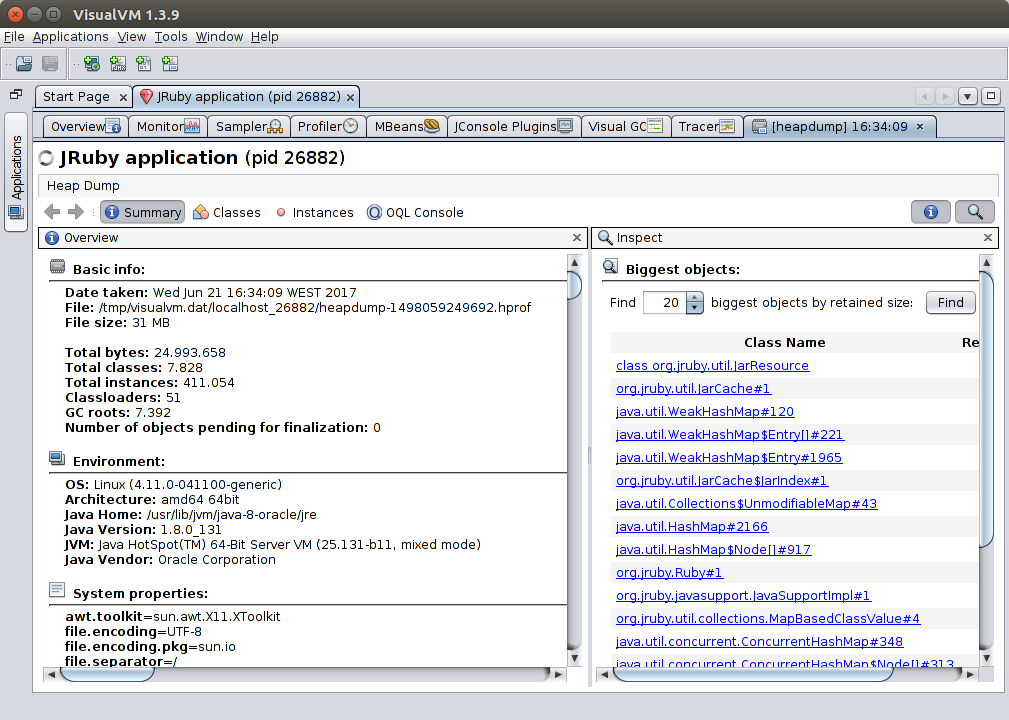
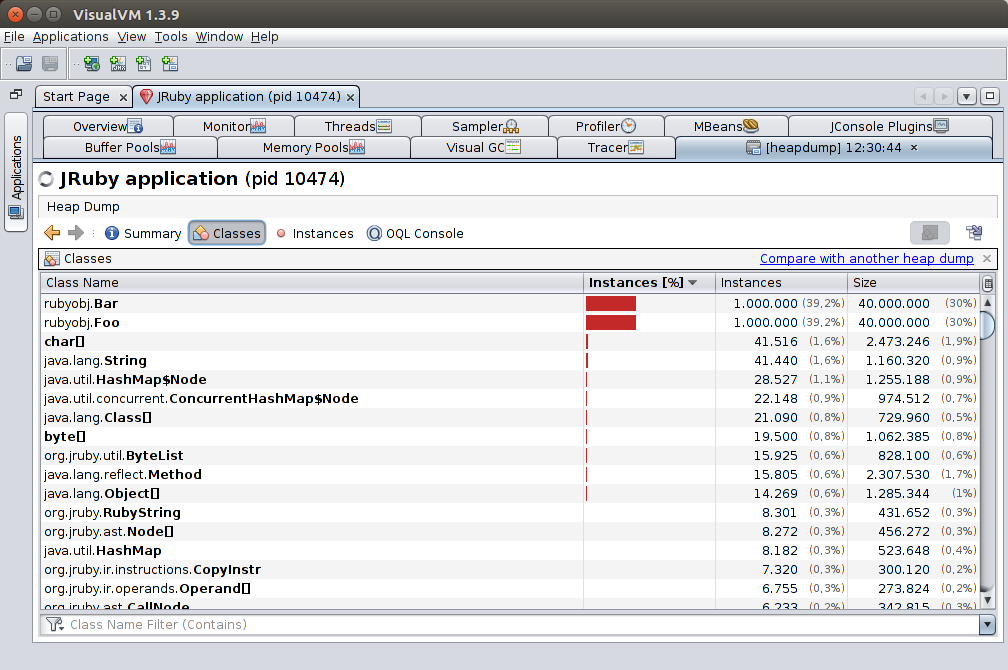
A heap dump is a snapshot of the state of the Java object/array heap. On the Summary pane you can see information on the dump and the stack traces at creation time. On the right you can immediately search for large objects on the heap.
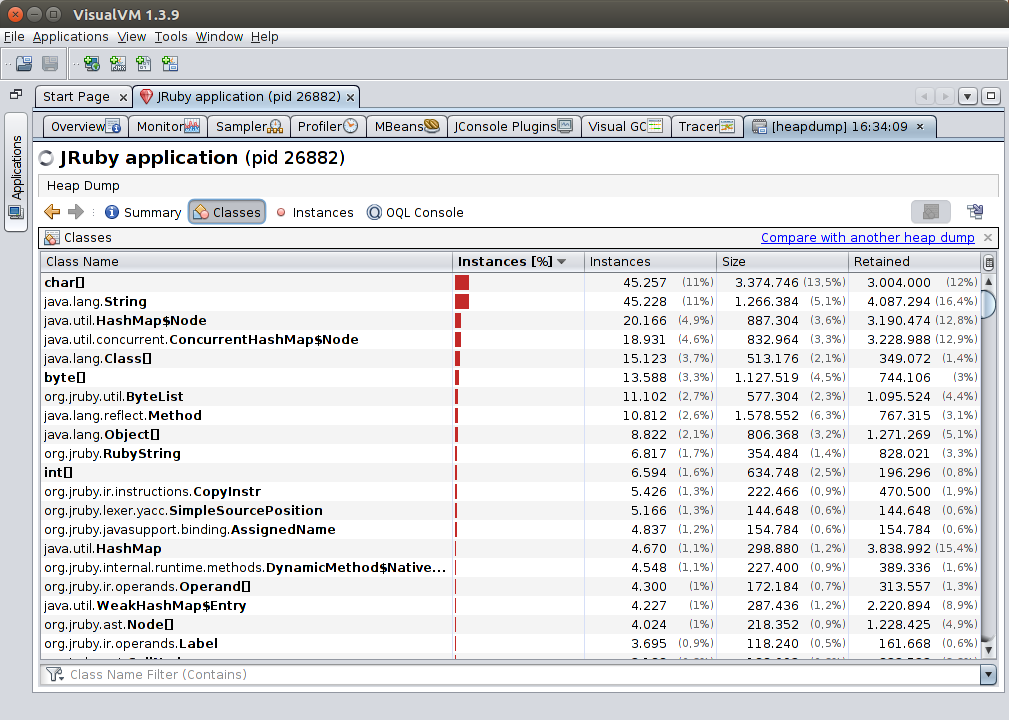
On the Classes pane you can see a summary of the state of the heap, broken down by class: name, number of instances, and size occupied by all of them. You can also press the “Static Fields” button to navigate into the contacts of the classes’ static fields.
When you double-click on a class, you’ll be taken to the Instances pane, where you can drill down into each instance of that class, individually.
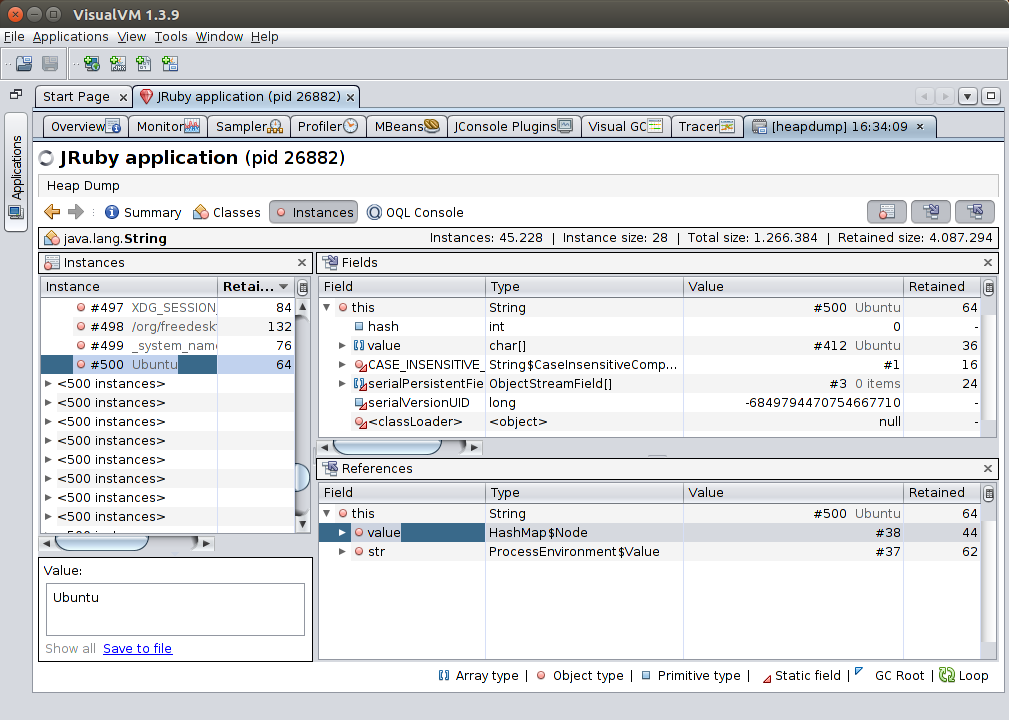
On the left pane, you can select any one of the objects you want to browse. In this case I’ve picked a java.lang.String containing my OS. On the top-right, you can see the object’s fields: the String is backed by a char[] containing the characters themselves.
In the bottom-right pane you can see all references to the object. This is a navigable view of the references that are pointing at the object, and we can see that our example object is referenced both in the value field of a HashMap$Node instance, and in the str field of a ProcessEnvironment$Value instance. Interestingly, this also lists references from local variables that are on the stack of currently-active threads.
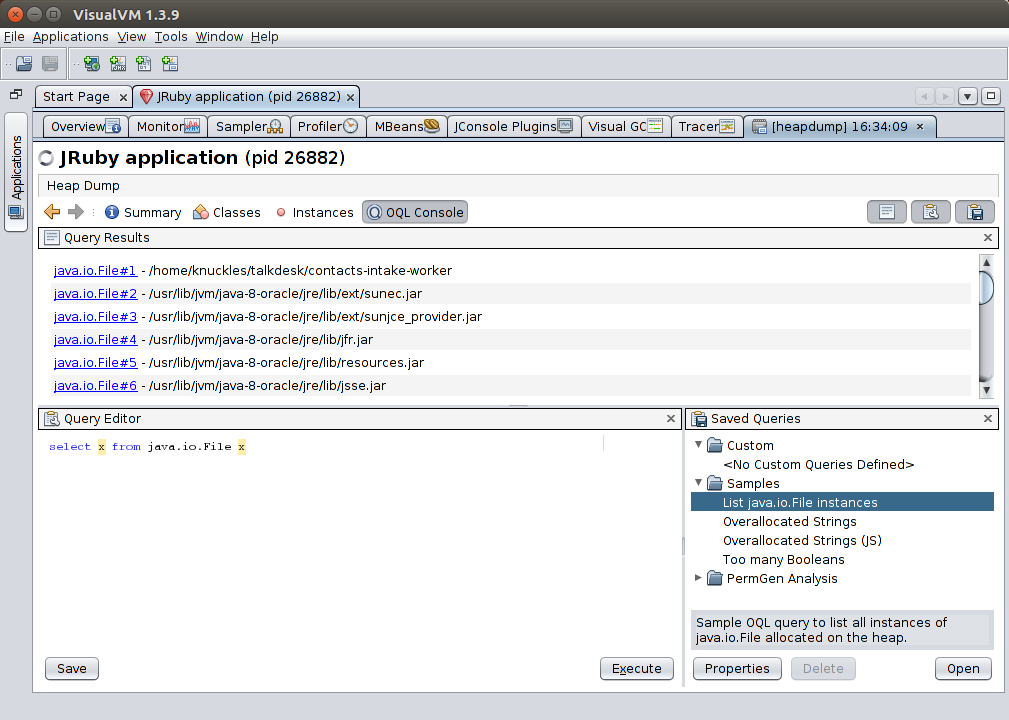
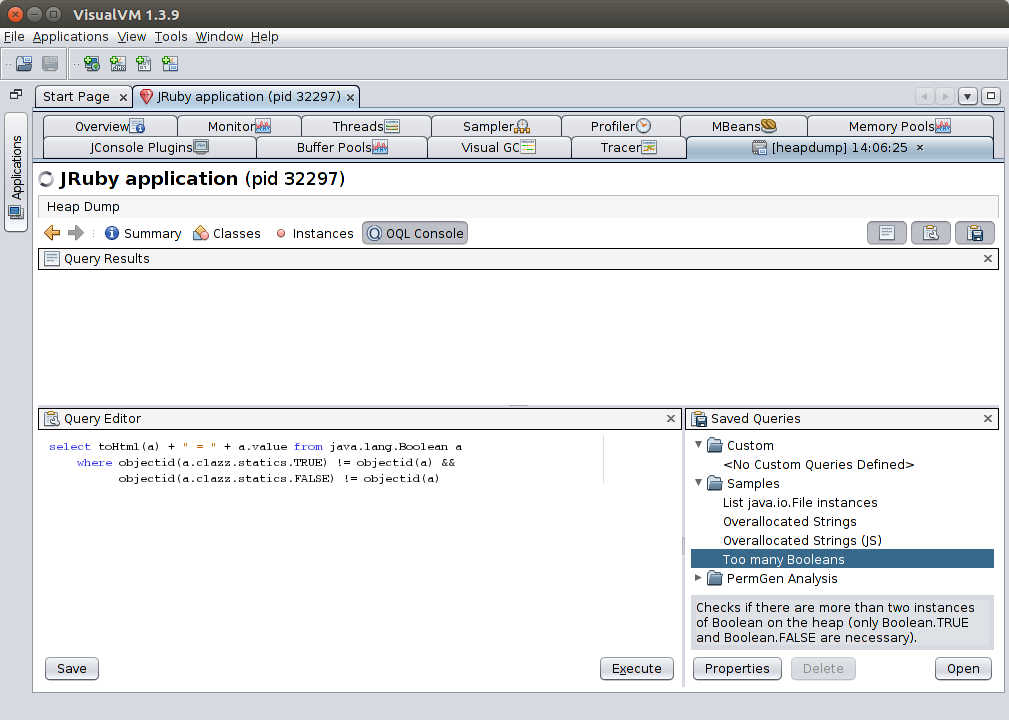
Finally, the OQL Console. This provides an SQL-like language for finding things on the heap — for instance, find all strings containing foo. It’s very powerful, so feel free to explore it.
Sampler panel: A simple sampling profiler
A sampling profiler works by taking thread dumps of the system at some regular interval and reporting on where it observes time being spent. This has the advantage of having a smaller performance footprint than a tracing profiler (introduced below), but it is therefore less accurate.
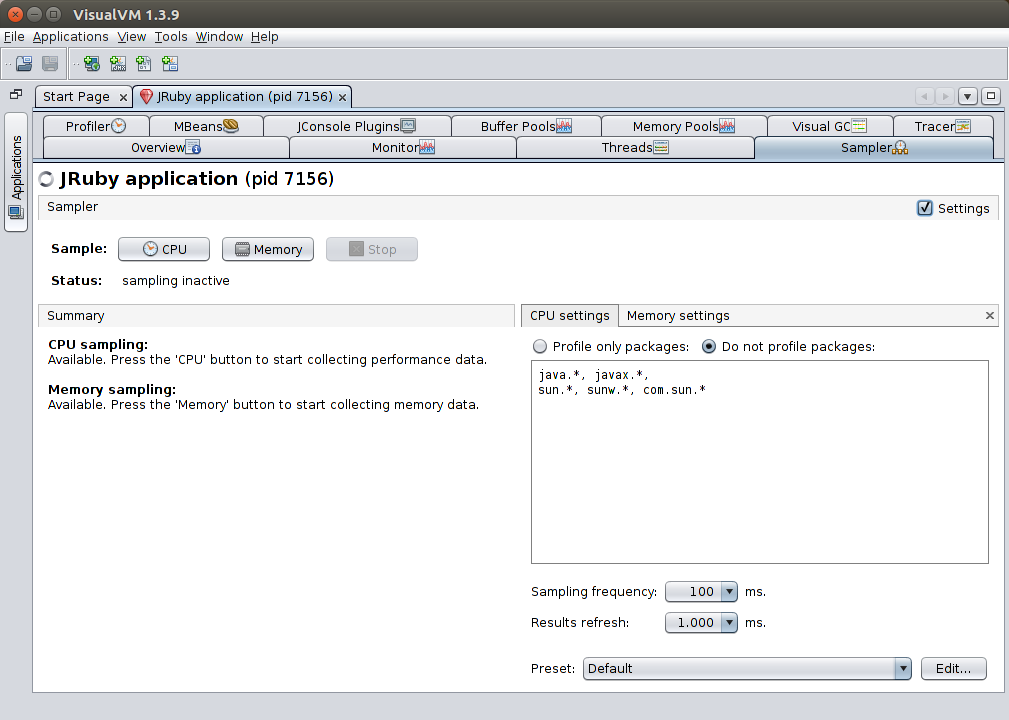
You can control the sampling frequency and how often VisualVM updates the visualization. You can either profile CPU or Memory.
Key Takeaway: Don’t run a profiler in production.
CPU Sampling
CPU sampling shows you where time is being spent on the application. The key is to know how to read the information:
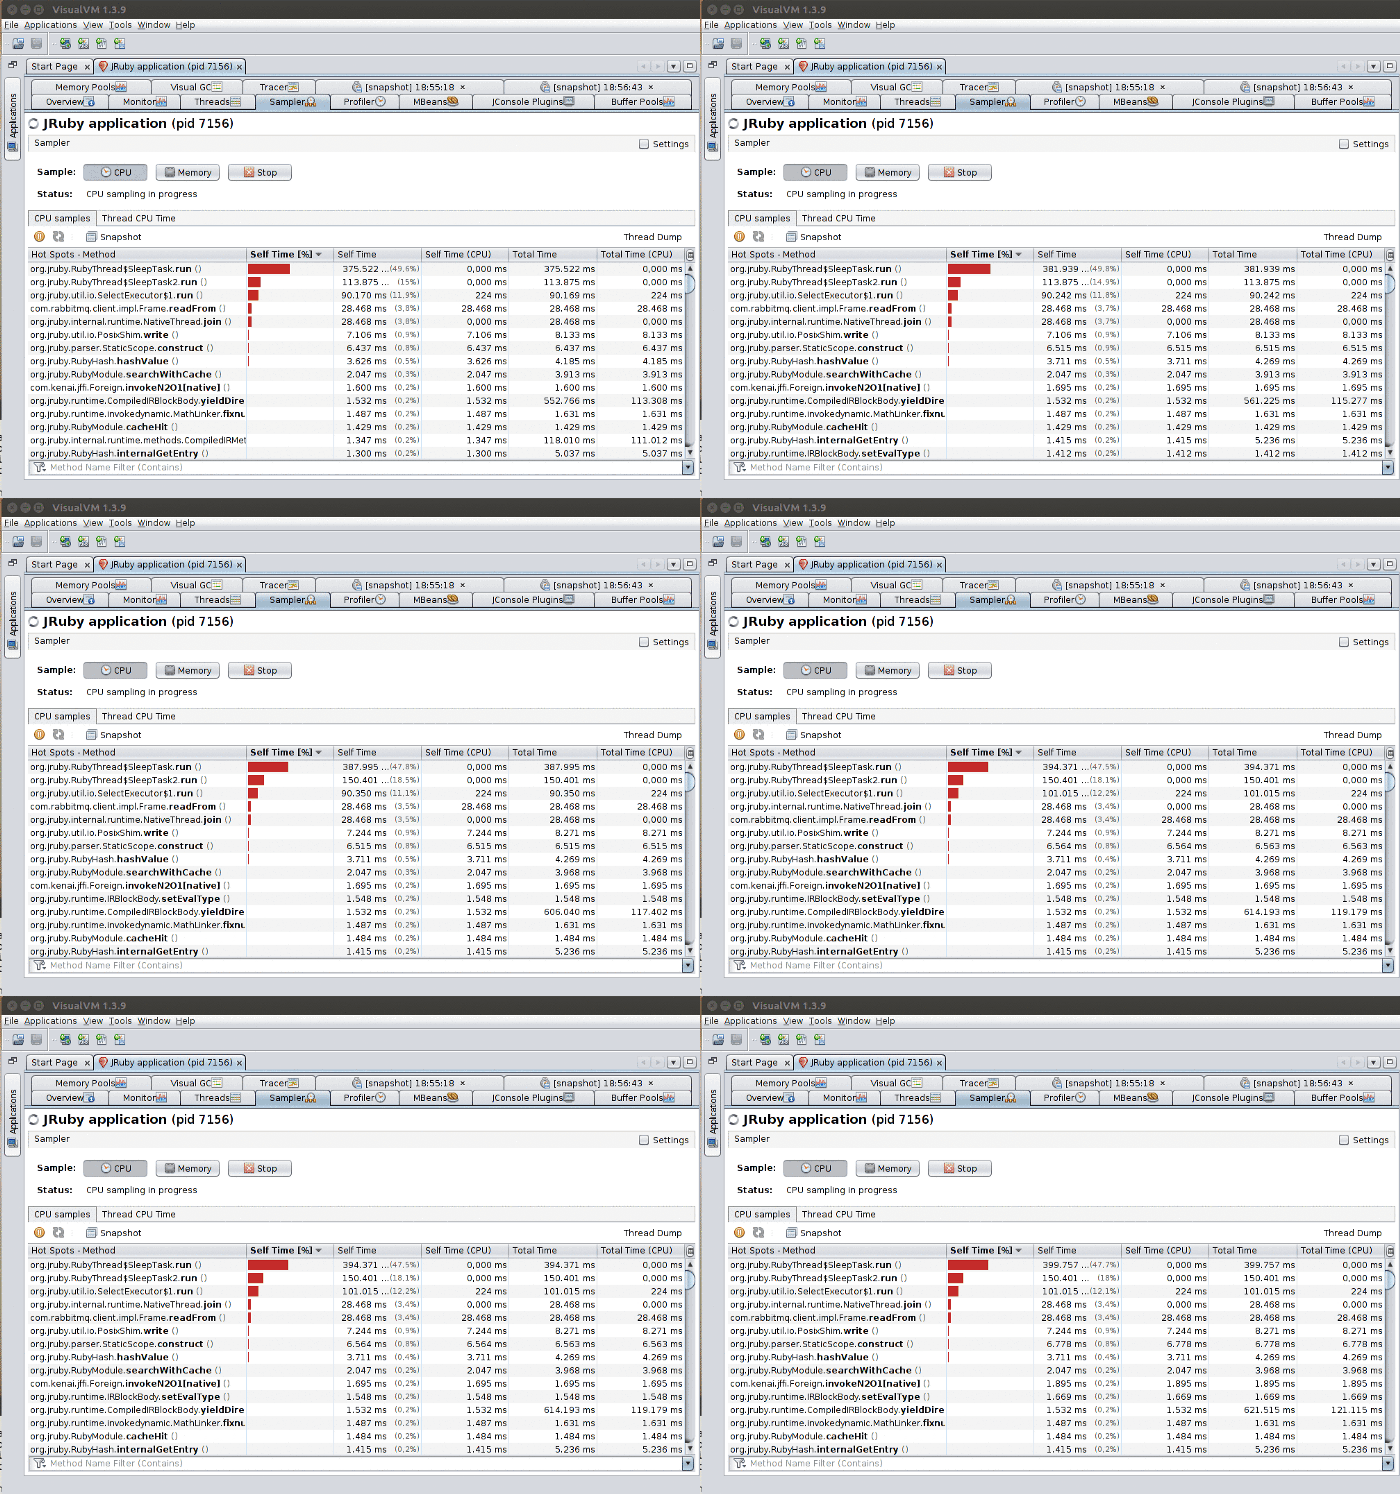
- Self time: How much time the profiler observed the listed method spent executing the method’s own code (e.g. if the method calls another method, it will not include that time). Note that packages configured as “not profiled” (as seen in the first picture of the section) are counted as “a method’s own code”. In practice, this means that if, for instance, you are doing a lot of string manipulation, time spent in JDK string code will be counted as self time (because JDK classes are configured as “not profiled” by default).
- Self time (CPU): How much CPU time was actually spent by the method. For instance in the image above, we can see a mostly-idle system that apparently spends a lot of time executing a small number of the methods. In reality, little CPU time is actually spent, because the code is just calling
Thread.sleep(). - Total time: Sum of all time “spent” with that method active on the stack. E.g. it also includes time in methods called by that method.
- Total time (CPU): How much CPU time the total time actually corresponded to. Like self time (CPU), a method may be active on the stack but the thread it lives on may actually be sleeping or waiting on I/O, e.g. no CPU is actually being used.
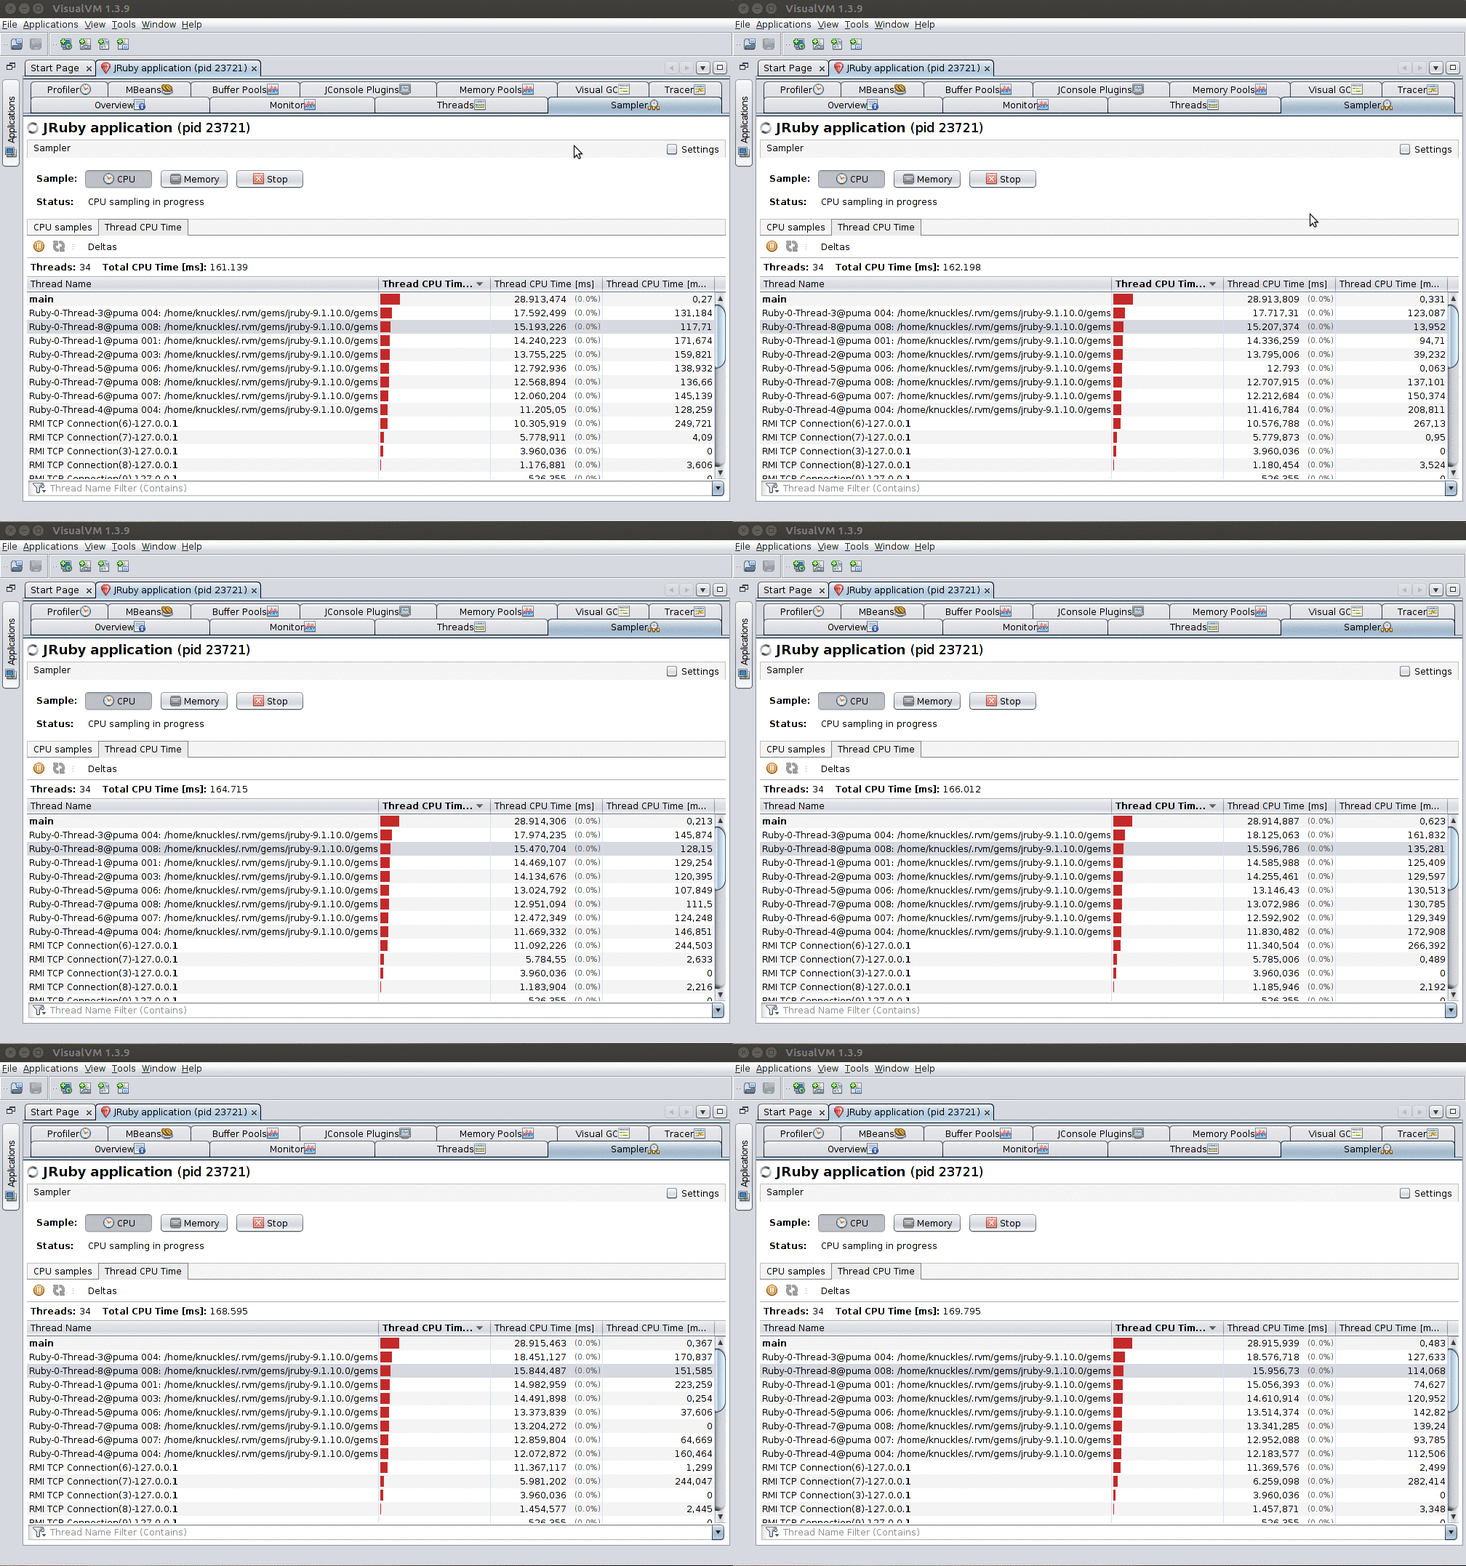
In the Thread CPU Time sub-panel you can view how much CPU time is being spent by each thread. This allows you to inspect CPU time since the sampling started (Thread CPU Time [ms]) and instantly (Thread CPU Time [ms/sec], on the far right).
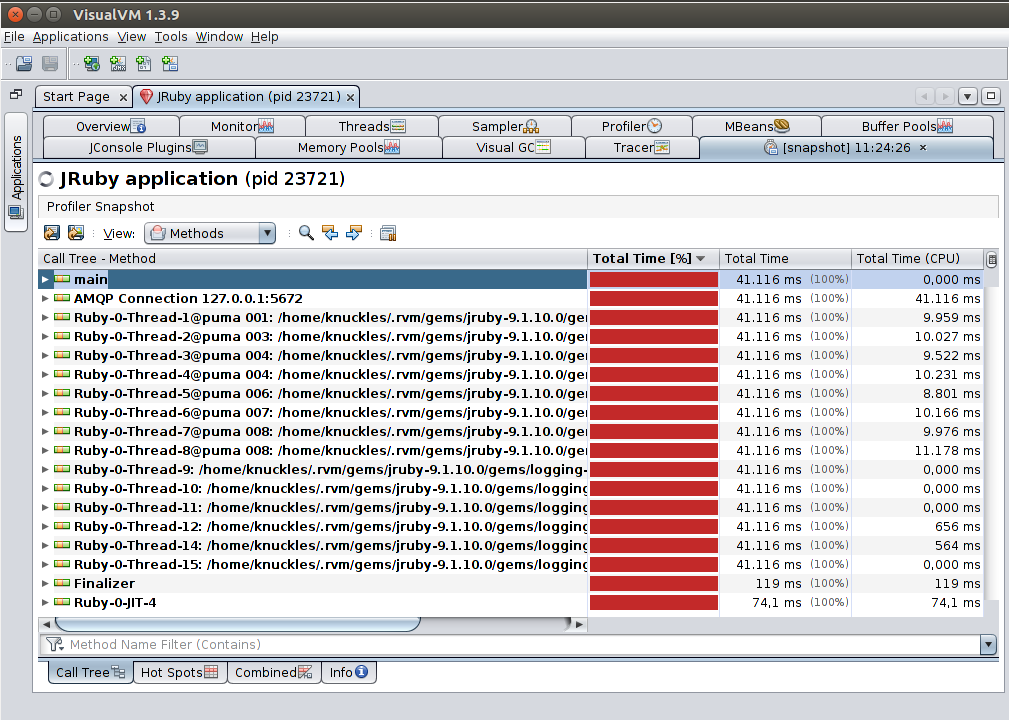
You can also take a Snapshot of the current data, which will open the Profiler Snapshot tab. This allows you to navigate a call tree visualization that includes both total time and total time (CPU), grouped by thread. The Hot Spots tab below also includes a snapshot of the live table info that the sampler shows.
Memory Sampling
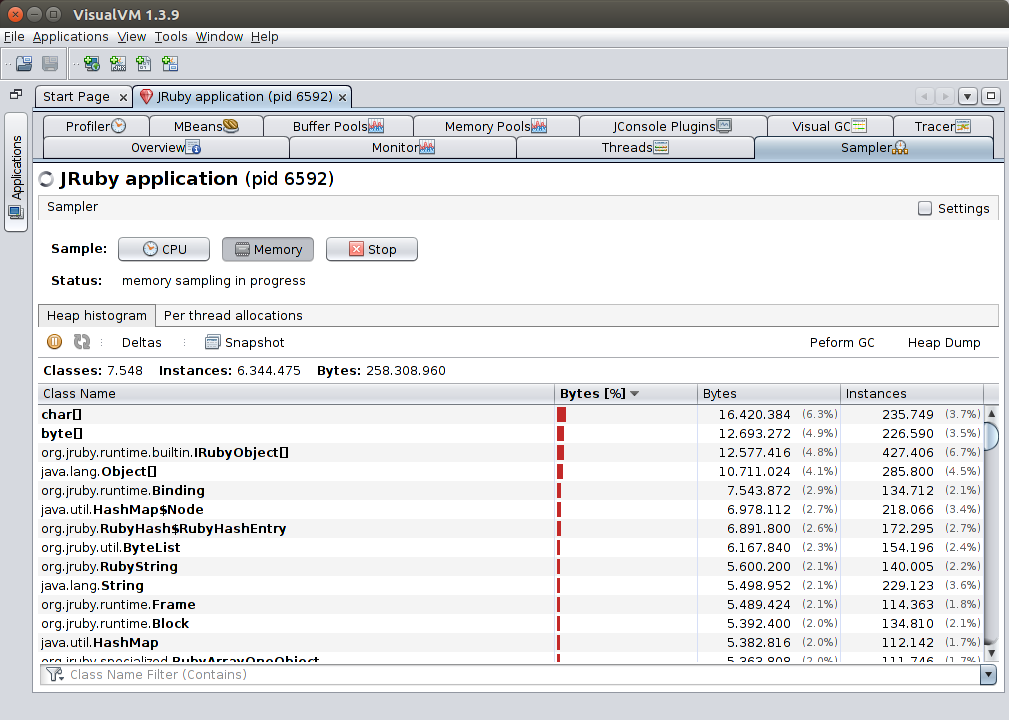
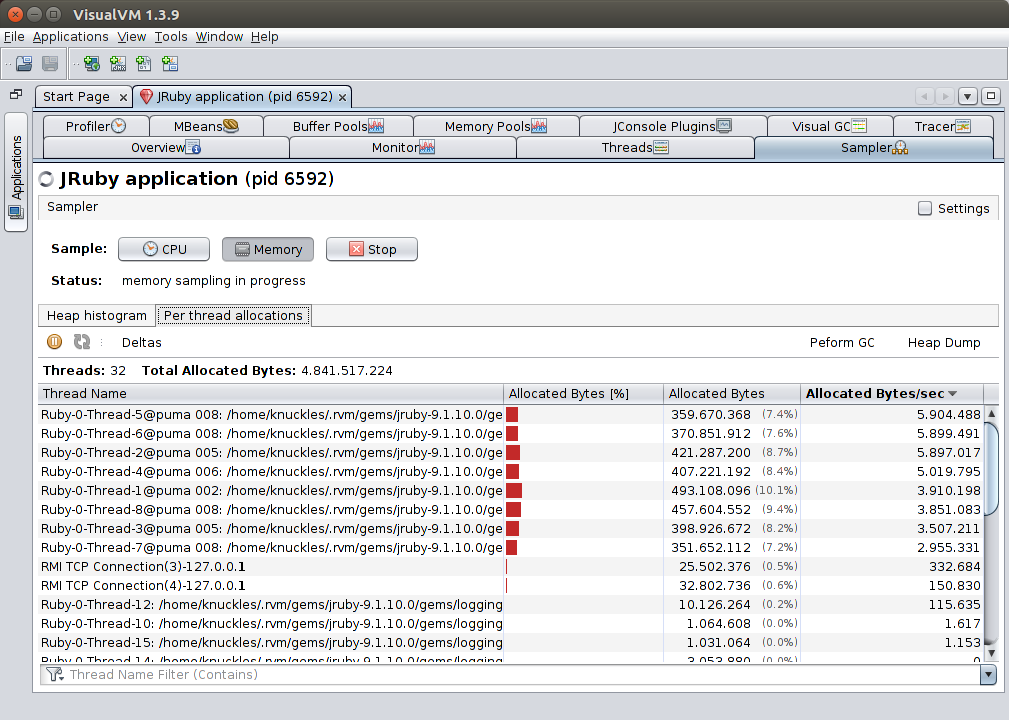
The memory sampler allows you to see a live view of the distribution of objects of the heap, and their footprint.
The Per thread allocations tab further breaks down allocation information per-thread, showing total allocated bytes and allocated bytes per second. This allows you to see which threads are more active in creating new objects.
Profiler panel: A simple Tracing Profiler
A tracing profiler works by modifying loaded bytecode in the JVM, adding counters to all methods so that it can accurately measure which methods are called and how much time is spent executing them. Note that this has a huge overhead, and the resulting profile may not reflect the performance of your application at all.
Key Takeaway: Don’t run a tracing profiler in any kind of non-local setup.
Other than that, the CPU part of the tracing profiler is very similar to its sampling counterpart.
Note for JRuby: The CPU part of the tracing profiler seems to break due to the JRuby’s use of automatically-generated bytecode; I was not able to get it to work beyond very simple examples.
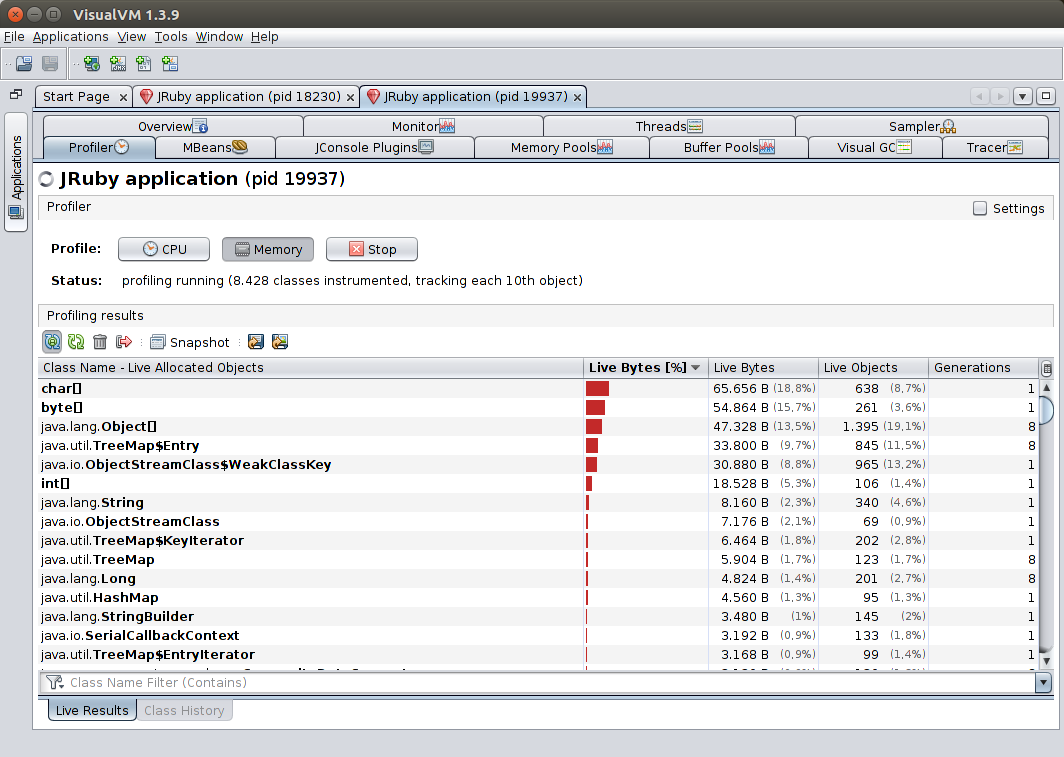
The memory tracing profiler provides a lot more information than its sampling counterpart, such as object counts and how many GC generations they live for.
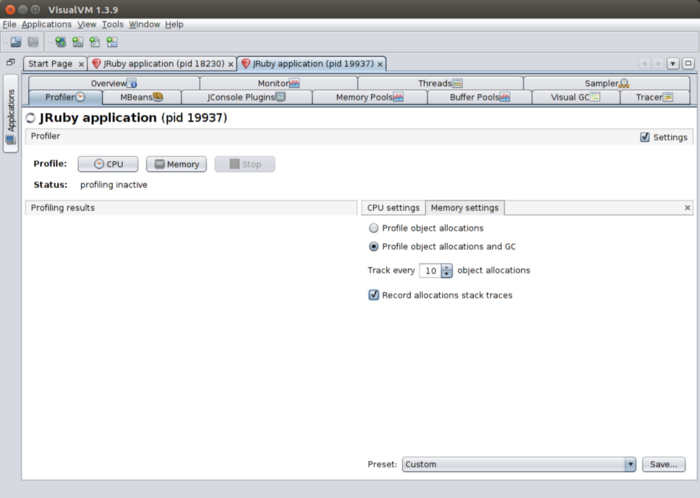
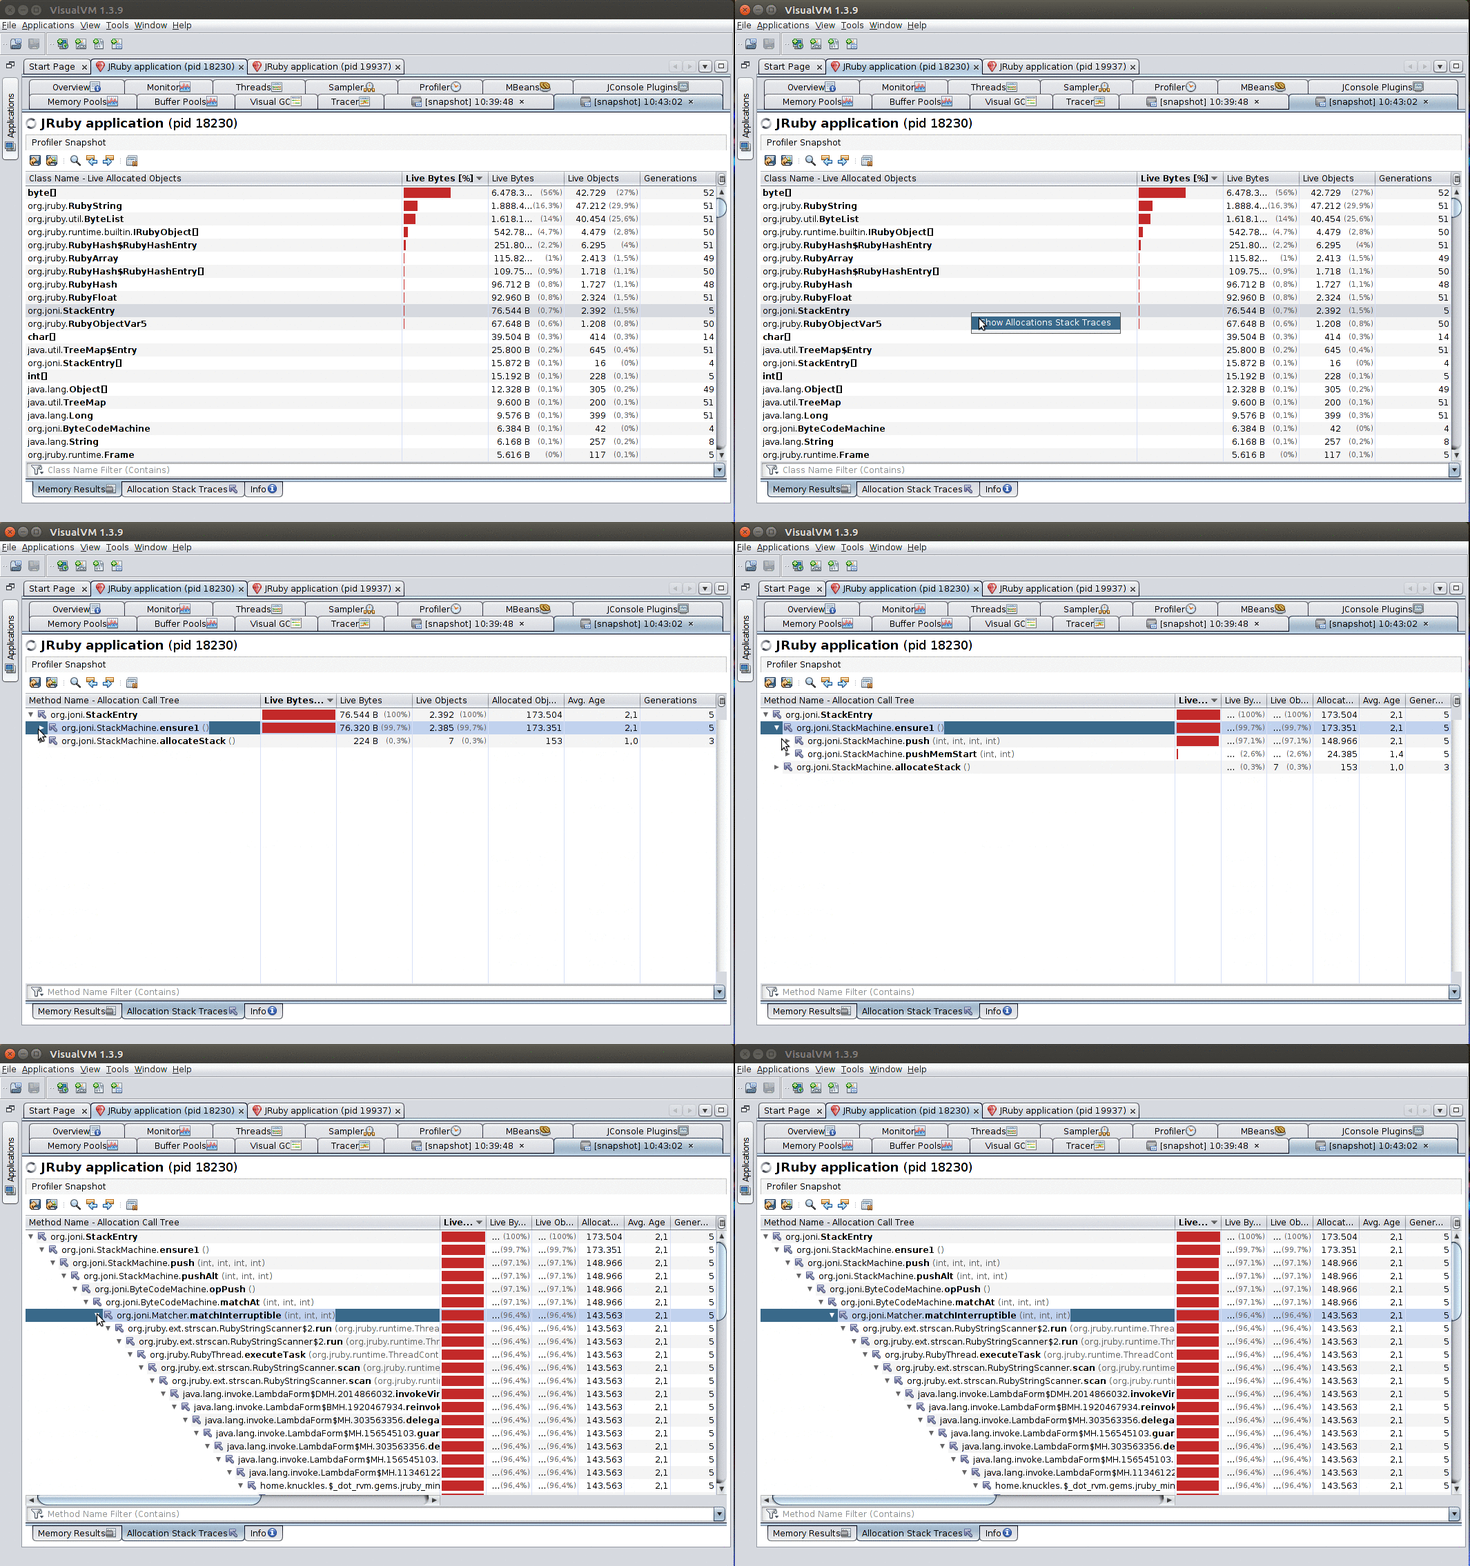
Furthermore, when you enable the Record allocations stack traces option, leave the profiler running and then take a snapshot, you’ll be able to explore the stack traces that led to objects being allocated by right-clicking a class and selecting Show allocations stack traces.
Recommended plugins
Out of the box, VisualVM already includes quite a lot of functionality, but if you go to Tools > Plugins you can get even more great tools. Below is a quick overview of them.
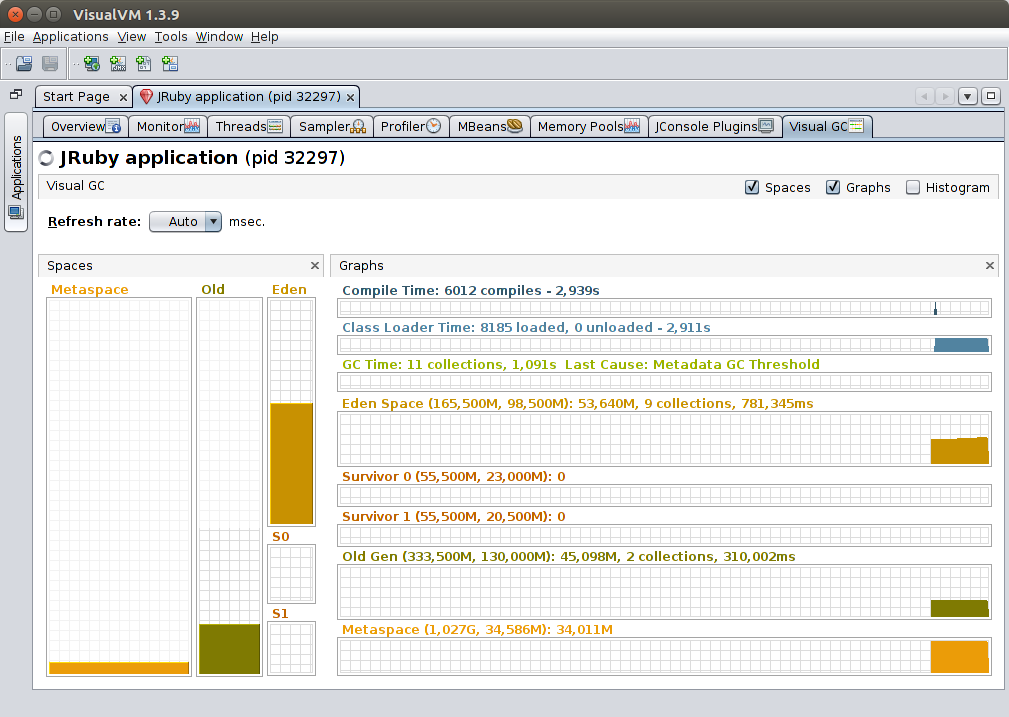
Visual GC
Includes detailed information on GC status, timings, and usage of various memory regions.
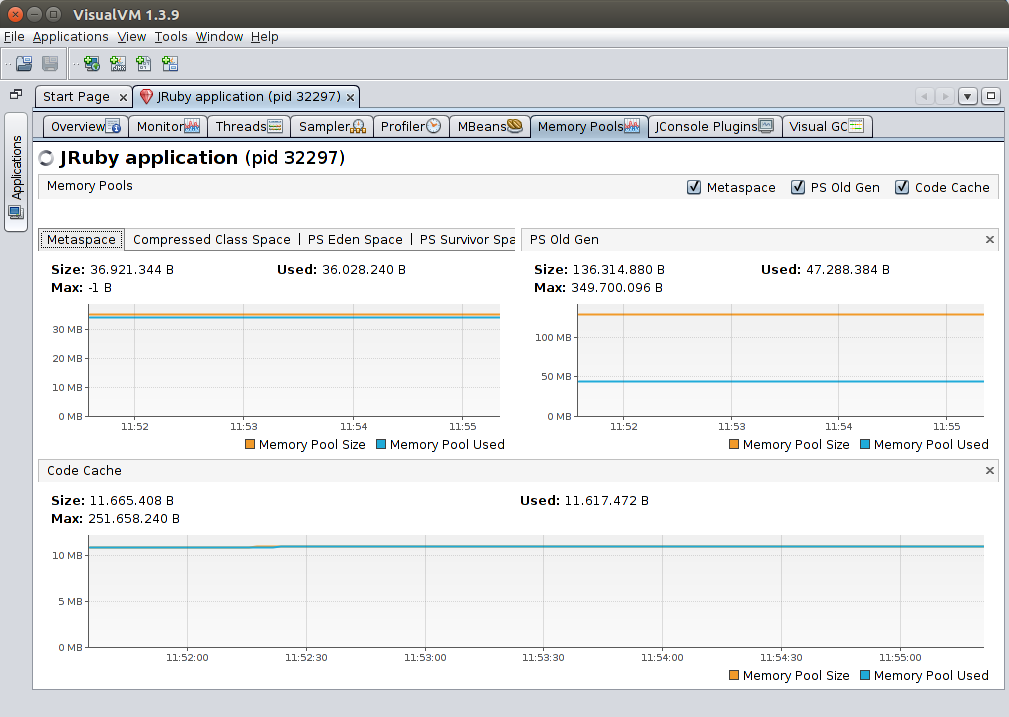
Memory Pools
Detailed metrics of all JVM memory regions, including things such as the code cache.
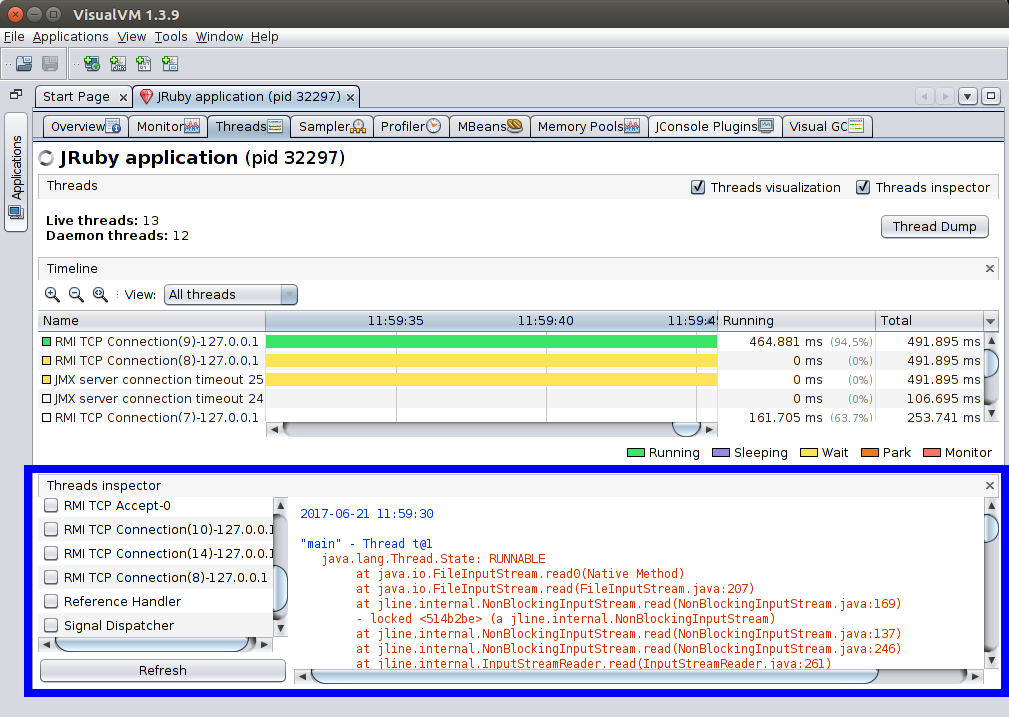
Threads Inspector
Adds an extra panel to the Threads tab where you can see the stack traces of the chosen threads.
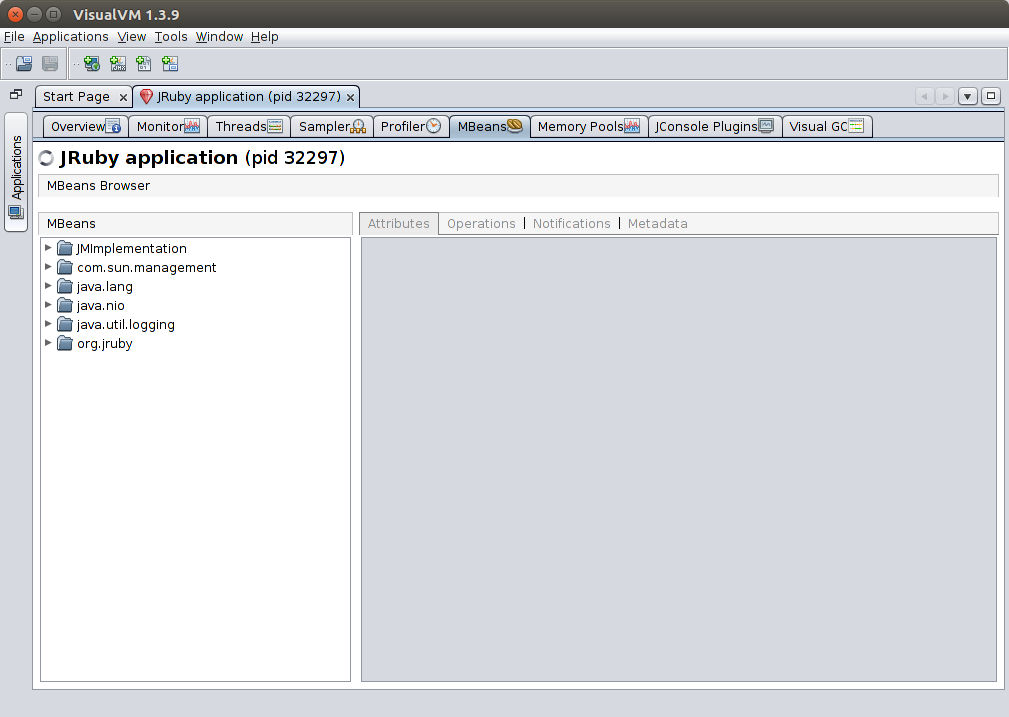
VisualVM-MBeans
Adds an extra tab that allows browsing and interacting with management beans. Management beans are a mechanism exposed by JVM and application components where they can expose their own metrics, configurations, and even allow live modification of some settings.
VisualVM-BufferMonitor
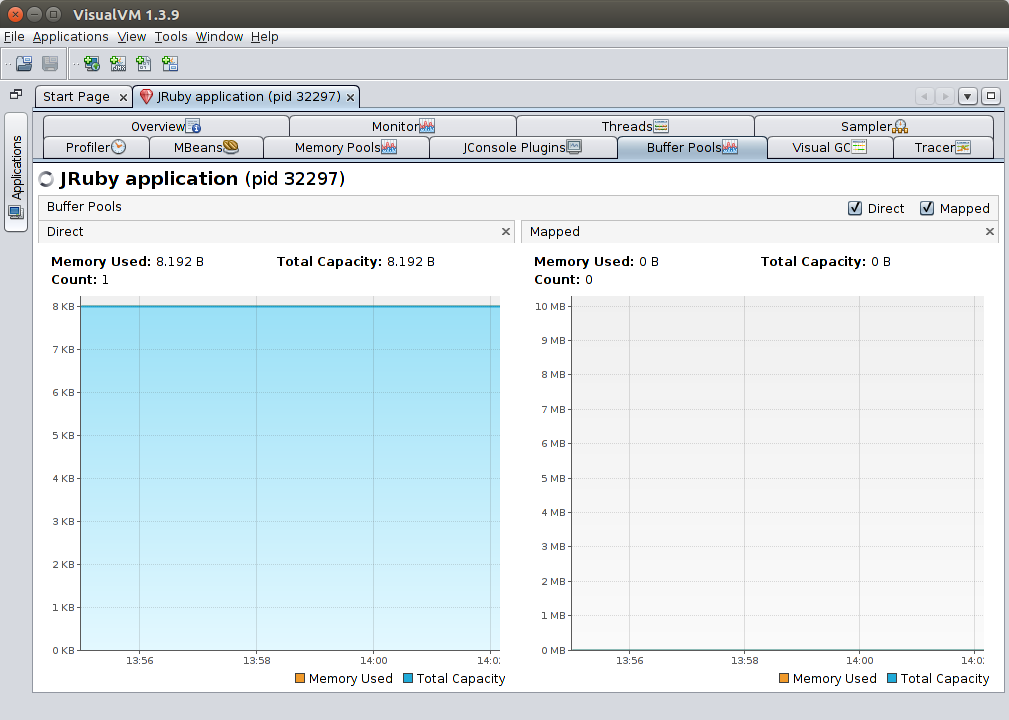
Adds a tab to monitor the JVM’s buffer pools. Note that like other pools discussed above, these are separate from the normal object heap.
VisualVM-JvmCapabilities
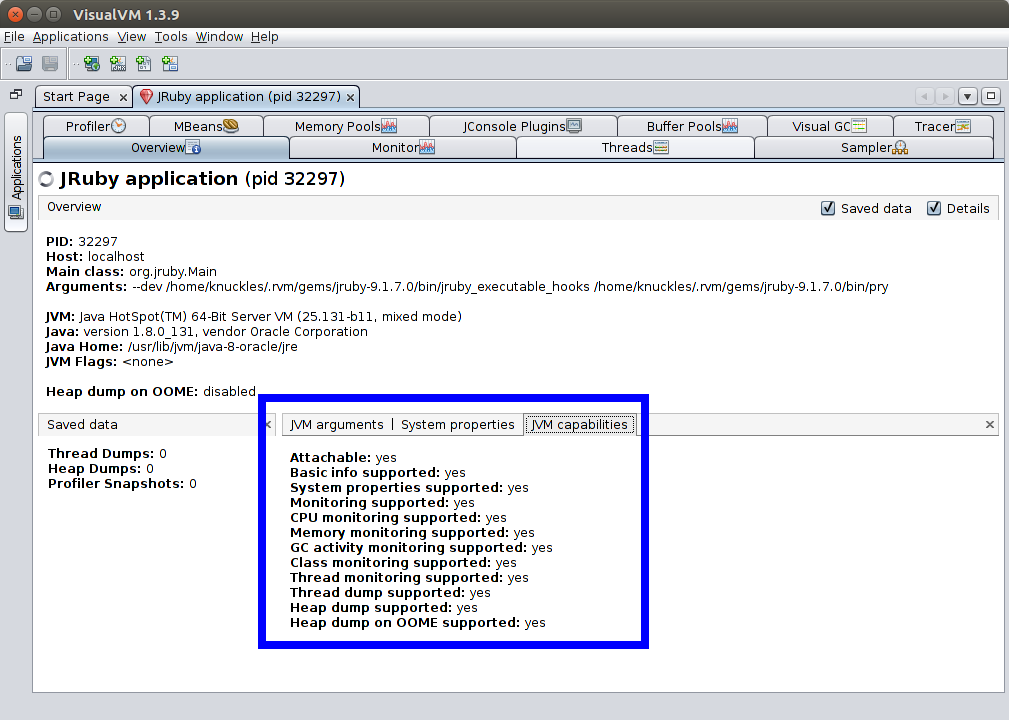
Adds a small panel listing available metrics and monitoring capabilities for the JVM being accessed.
OQL Syntax Support
Adds syntax highlighting, indentation help and autocomplete to the OQL language used to perform queries on heap dumps.
Tracer-* Probes
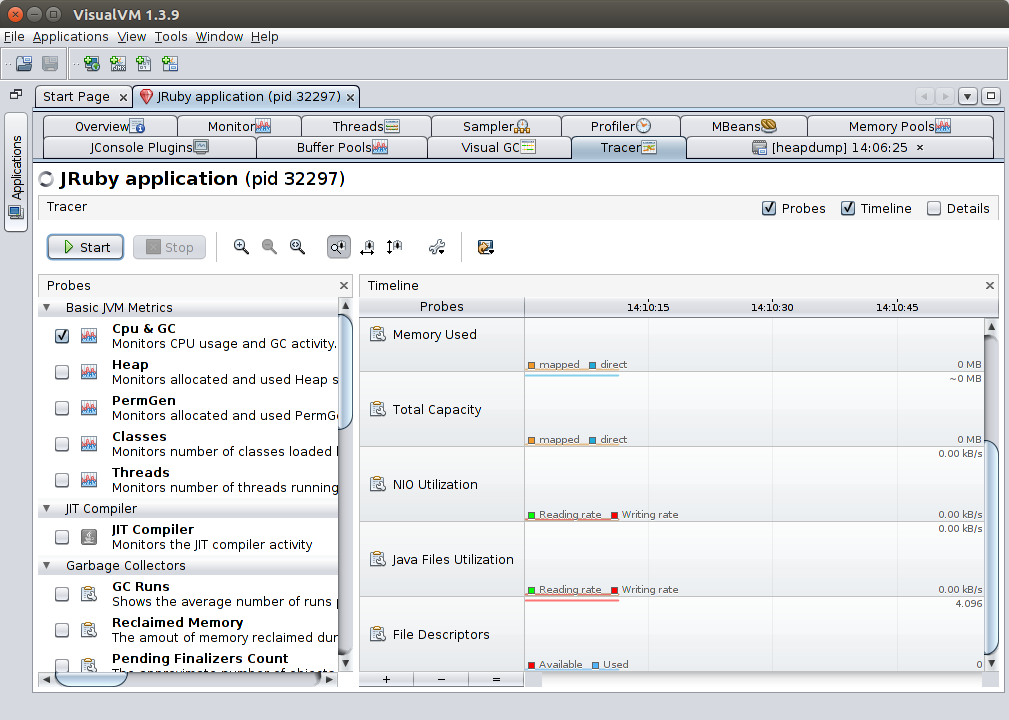
Enables the Tracer tab, adding other metrics that can be monitored and graphed.
JRuby goodies
The JRuby Management Bean
When using the VisualVM-MBeans plugin you can also enable the JRuby management bean by adding the -Xmanagement.enabled=true option to your JRUBY_OPTS environment variable or to the JRuby command line directly.
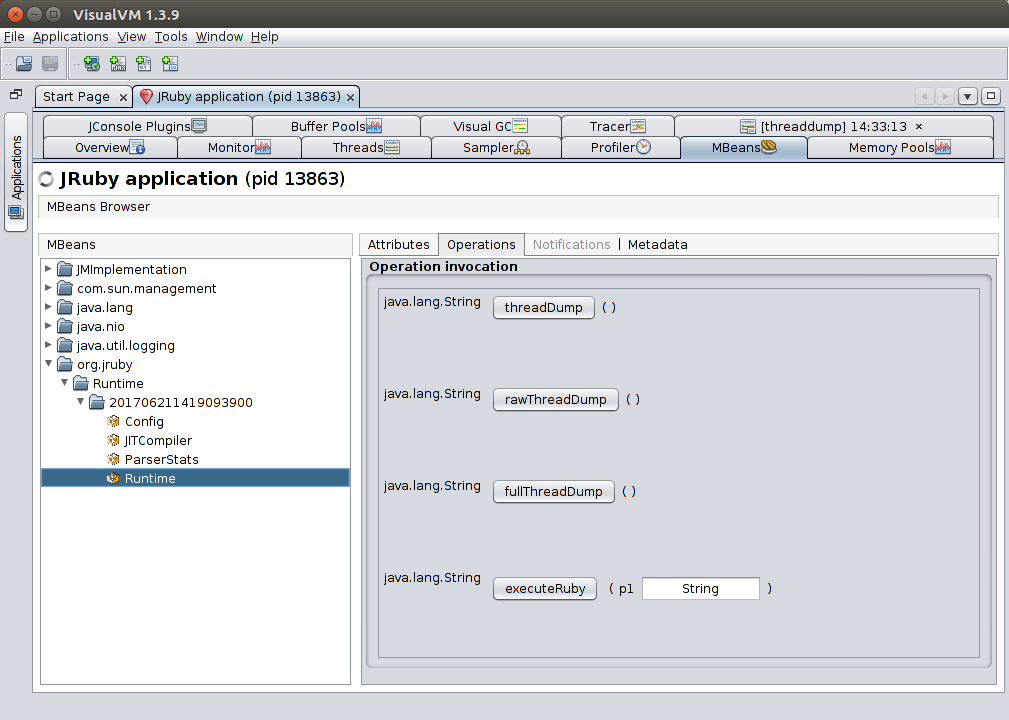
This management bean exports a number of very useful operations under the org.jruby > Runtime > … > Runtime item:
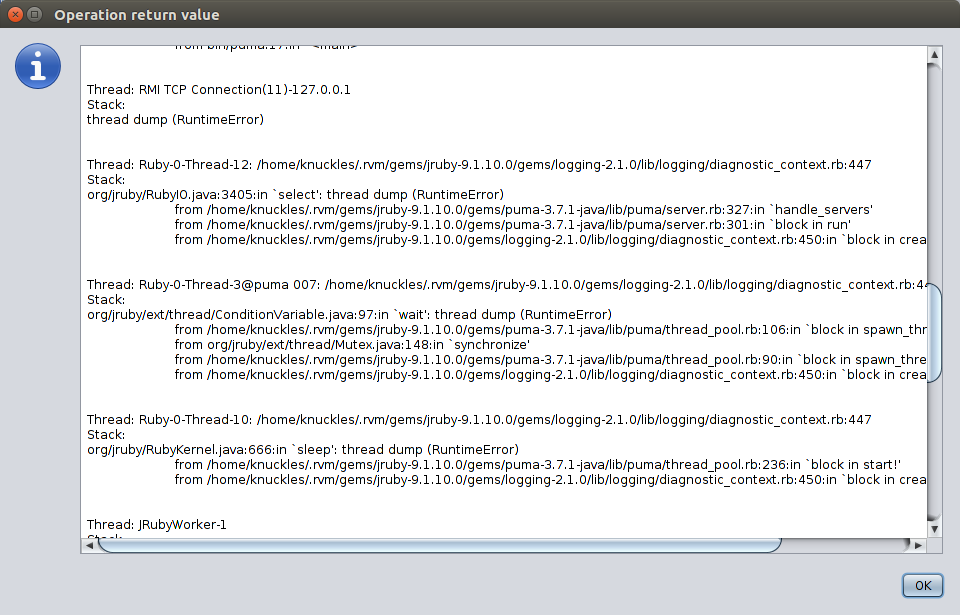
You can get a Ruby-level thread dump using the threadDump operation. This displays a stack trace as what you’d expect to see on MRI, instead of the raw Java one you can get with the Thread dump option in the Threads tab.
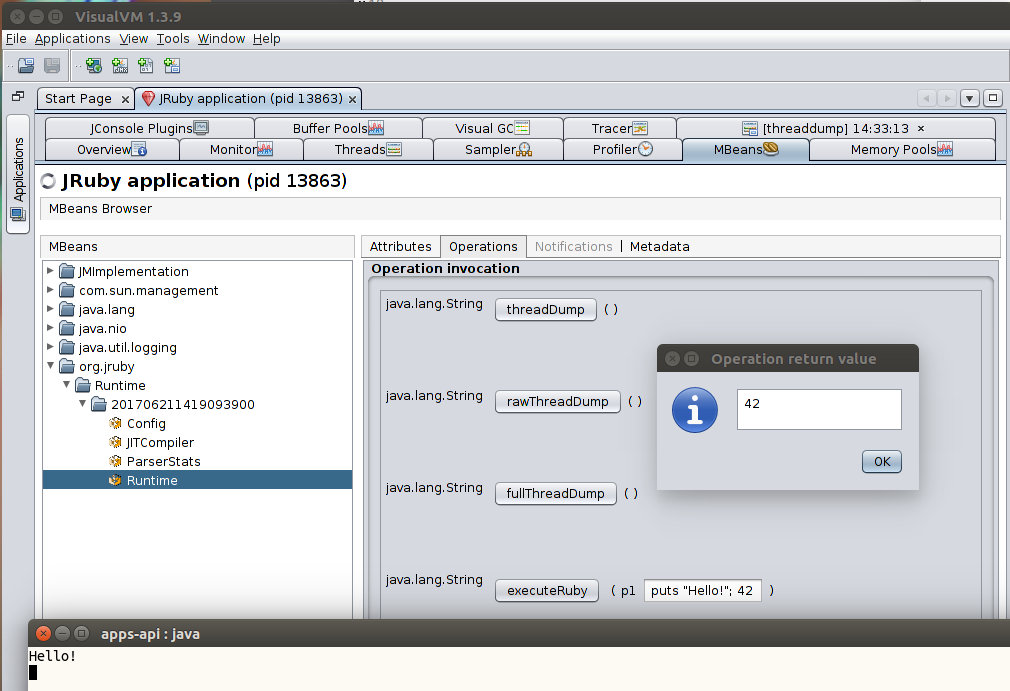
You can also (and obviously be very careful about what you do here) send Ruby code to be eval()’d by JRuby using the executeRuby operation. You may even want to do something like require "pry"; Pry.start. Use your imagination 😀.
Reading raw JRuby stack traces
Similarly to how a lot of JVMs work internally, JRuby starts off interpreting your Ruby code, and as it warms up and detects hot spots it JITs your Ruby code into automatically-generated Java classes, which function similarly to callables, and contain your Ruby methods (or parts of them). All of this happens behind the scenes, but when you ask for a Java-level thread dump, you’ll see this process in action.
This means that by default in your stack trace you’ll probably find a mix of JRuby interpreter methods and the JRuby JIT classes, which looks somewhat like this:
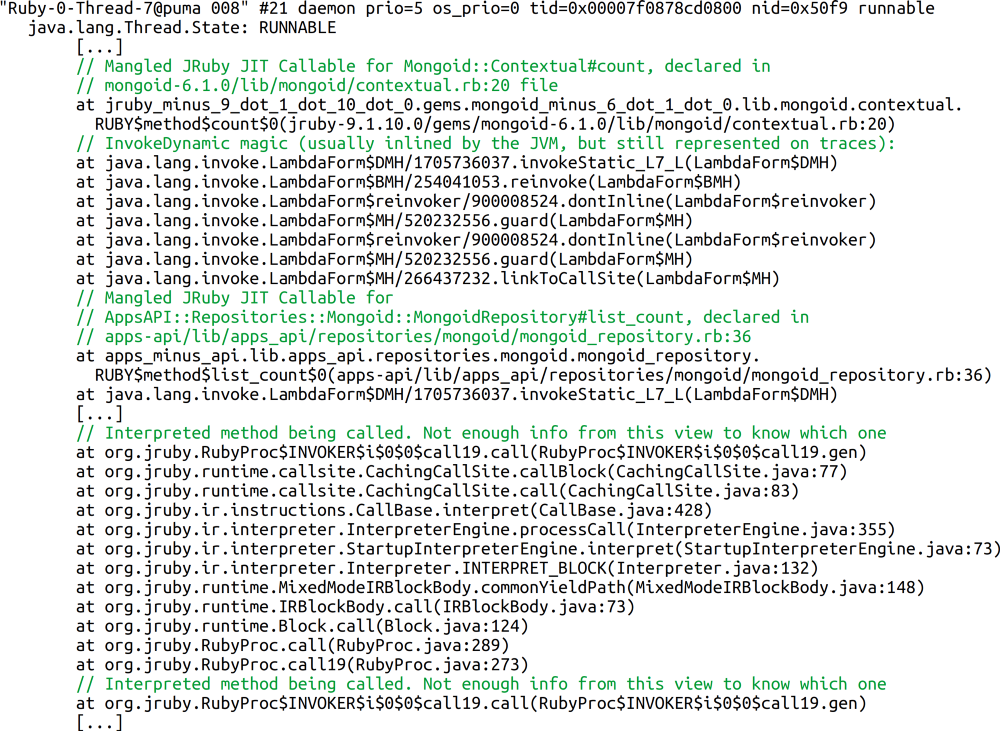 Pardon for the raster nature of the example
After the JIT callable is generated, the class/method name is rather ugly, but it accurately tells you what code is running, and where it came from.
For debugging reasons you may want to force JRuby to compile every Ruby method into one of these callables, rather than doing this only for hot methods. You can do so by adding the -Xcompile.mode=FORCE option to your JRUBY_OPTS environment variable or to the JRuby command line directly. This has the advantage of allowing you to see every single Ruby method represented on the Java stack — instead of seeing some of the methods only as JRuby interpreter method calls — but has a memory and performance penalty.
Analyzing JRuby heap dumps
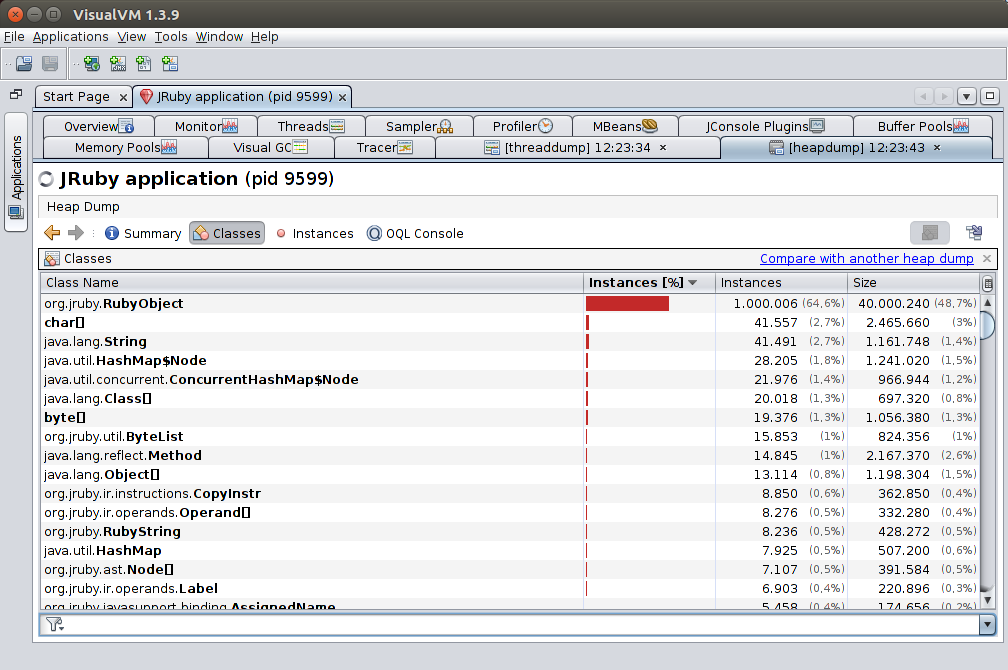
By default, all Ruby objects are represented in the Java heap as instances of the class org.jruby.RubyObject. This means that if you’re after a Ruby object memory leak, this will not help you. You could use OQL to try to identify classes and whatnot, but there’s actually a simpler way:
If you add the -Xreify.classes=true option to your JRUBY_OPTS environment variable or to the JRuby command line directly, JRuby will generate JVM classes inside the rubyobj package corresponding to each Ruby class (with matching Ruby namespace too). Unfortunately, this feature has some known bugs; a workaround is included in the issue report, but you’ll need to patch your JRuby instance, which is a bit more involved.
Further exploration
Here are some commercial and free tools you may want to take a look at, if you’re interested in VisualVM:
